Doji Candle
When traders analyze the market, they rely on patterns that form on price charts, and doji candles are one of the most widely used instruments. Reflecting intraday and mid-term price changes, they show market indecision or an upcoming shift in the existing trend. This article is all about Japanese candles and chart analysis: it explains how candles form, shows how to read them and craft a pricing strategy, and provides examples of various doji types.
Table of Contents
What is a doji candle?
How is the Japanese "doji" candle formed?
How does it work?
Doji candlestick pattern example on the Forex market
Doji candlestick types
Advantages and disadvantages of Doji candlestick
What Is the Difference Between a Doji and a Spinning Top?
How to read a Doji candlestick
How to use a Doji candlestick in trading – Best strategy
Conclusion
FAQ
What is a doji candle?
A doji Japanese candle is a candlestick formation that shows up on charts when there is market uncertainty and no longer any price movement. A doji often denotes the potential for a trend reversal.
How is a Japanese doji candle formed?
Since it can signal the formation of a peak, the doji pattern is quite common in trading, especially when it follows a lengthy white (bullish) candlestick. A doji alerts buyers to waning demand and a potential negative reversal when a positive trend lasts for a while and an asset is overbought.
The doji signal, however, loses part of its power when the market is in a downturn, since the doji candle announces that there are equal forces at work in the market, meaning that both growth and decrease are possible, and that the downtrend may continue.
To confirm a price reversal and the beginning of a new trend, it is crucial to find a stronger signal when the trend reaches a low. For example, it could be a doji morning star pattern, which is formed by three candles.
How does it work?
Being a possible indicator of upcoming market shifts, doji candlesticks have traditionally assisted traders in predicting market bottoms and peaks.
For instance, a doji candlestick that appears during an upswing may be a sign of bullish exhaustion, which is when more buyers start to lean towards the sellers and the trend begins to reverse.
It is important to remember that a trend reversal is not always indicated by the doji pattern. Instead, it reveals traders' uncertainty about potential developments.
Therefore, it is preferable to use additional technical indicators to verify the doji candlestick formations. The relative strength index (RSI) or Bollinger Bands might confirm or contradict what the doji pattern says.
Doji candlestick pattern example on the Forex market
Following a substantial, high-volume increase, the shares of Cyanotech Corp. (CYAN) formed a gravestone doji on the following chart in February 2018. This might portend a short-term negative reversal following the breakout.
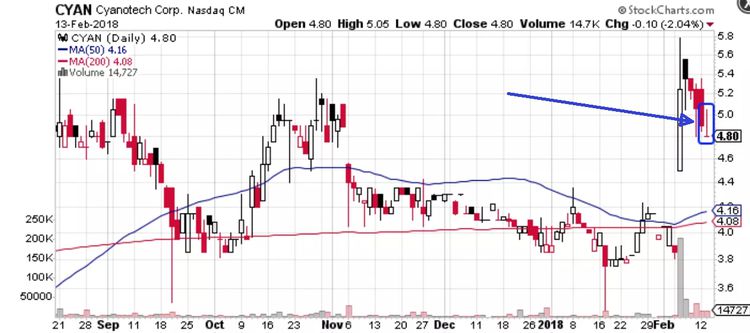
In this case, the tombstone doji may indicate that there would be a further downtrend from the present levels to close the gap at the 50- or 200-day moving averages, which are at $4.16 and $4.08, respectively.
To validate a probable breakdown, traders would also look at additional technical indicators, such as the relative strength index (RSI) or the moving average convergence/divergence (MACD). Even while intermediate-term traders could set a larger stop-loss in this scenario to prevent getting knocked out of the trade, day traders can also set a stop-loss higher at about $5.10.
Types of doji
Depending on the length and the strength of a market trend, there are different types of doji candles – let’s review them in detail.
Standard doji
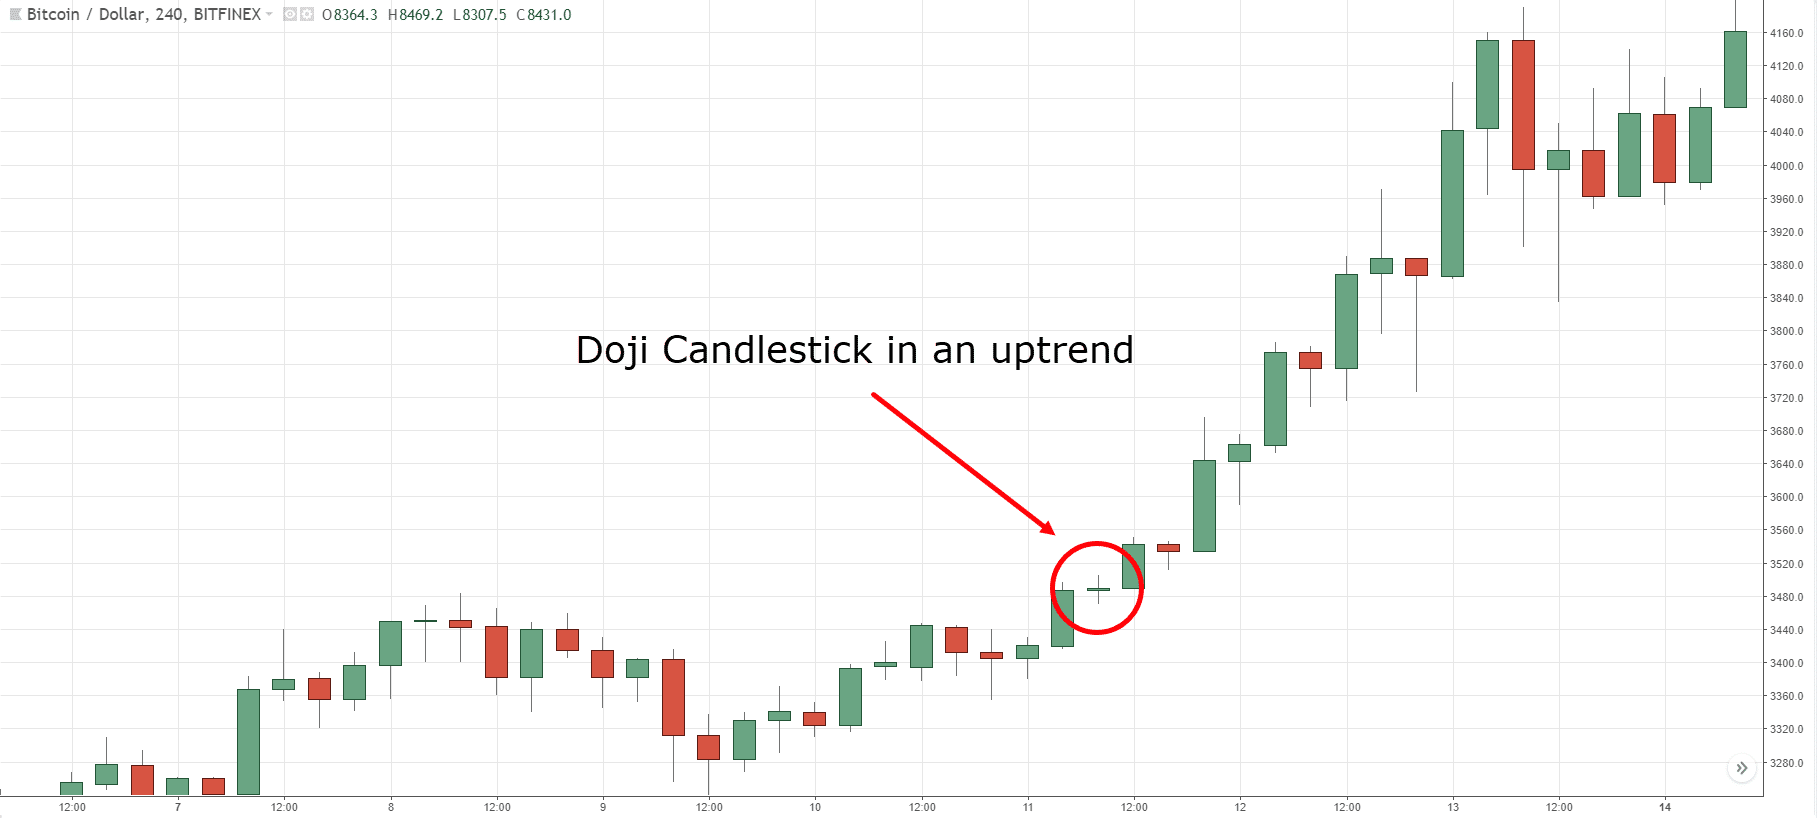
A single candlestick known as a standard doji does not necessarily mean much by itself. Traders look at the price activity leading up to the doji to determine what this candlestick represents.
Doji candlestick patterns should only be used as a starting point for trades. For instance, a standard doji within an uptrend can prove to be a part of the uptrend's continuation. However, the following chart illustrates a reversal of an upward trend, demonstrating the significance of confirmation following the appearance of the doji.
Dragonfly doji
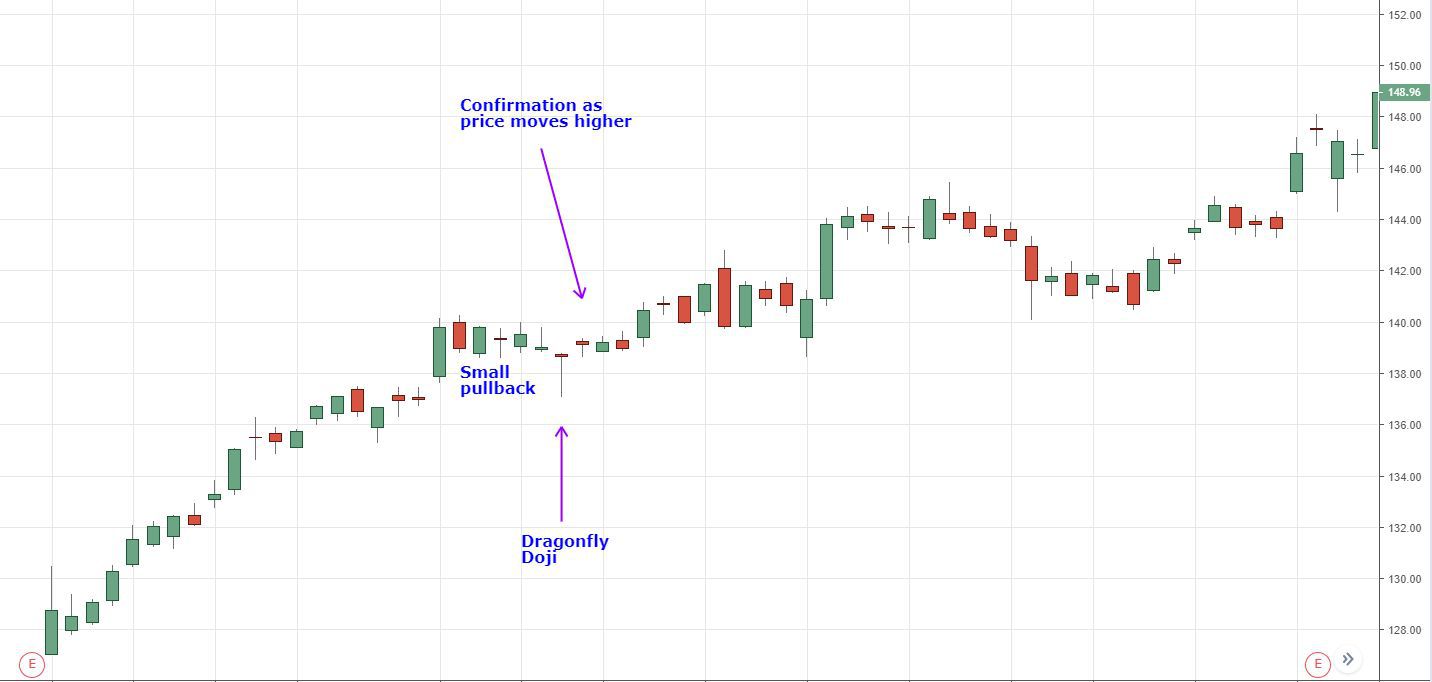
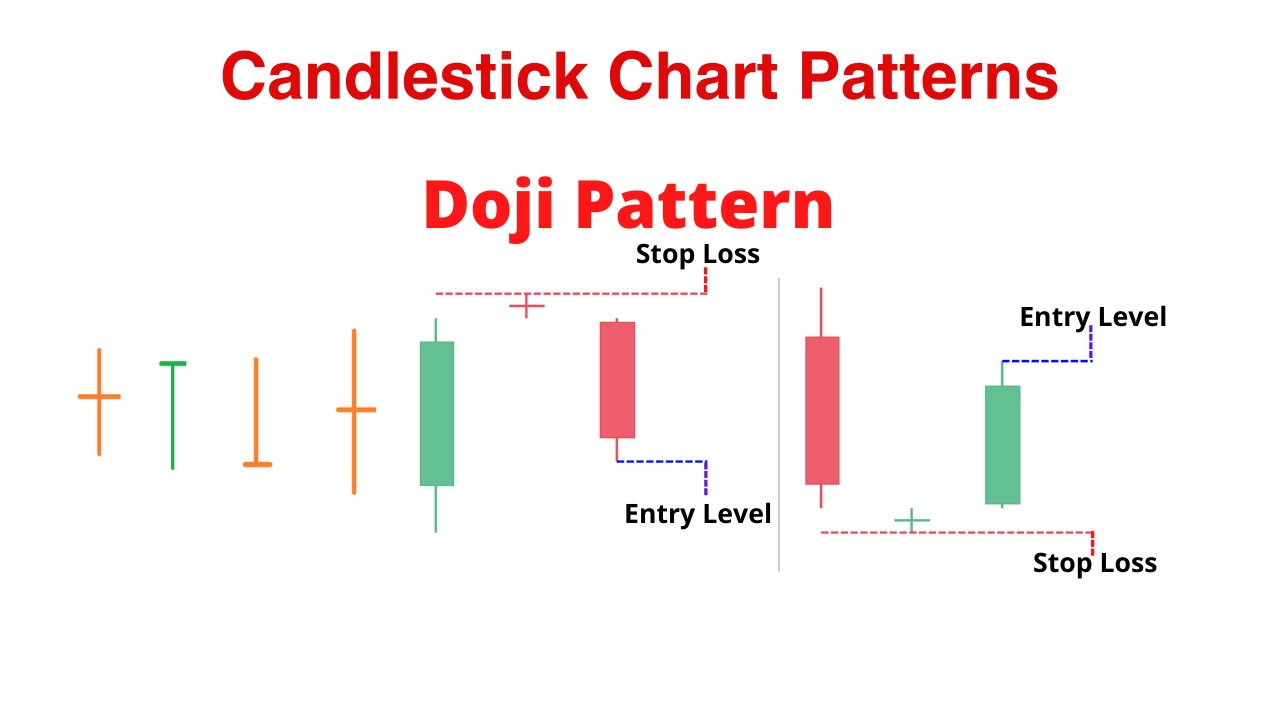
The dragonfly doji has a T-like shape and resembles a dragonfly. A dragonfly doji forms in an uptrend, but it typically occurs in a decline and indicates a reversal. However, it needs further verification by other candlestick patterns when it happens during an increase. A dragonfly doji has a longer lower shadow than the top shadow, which gives it a more bullish character.
Long-legged doji
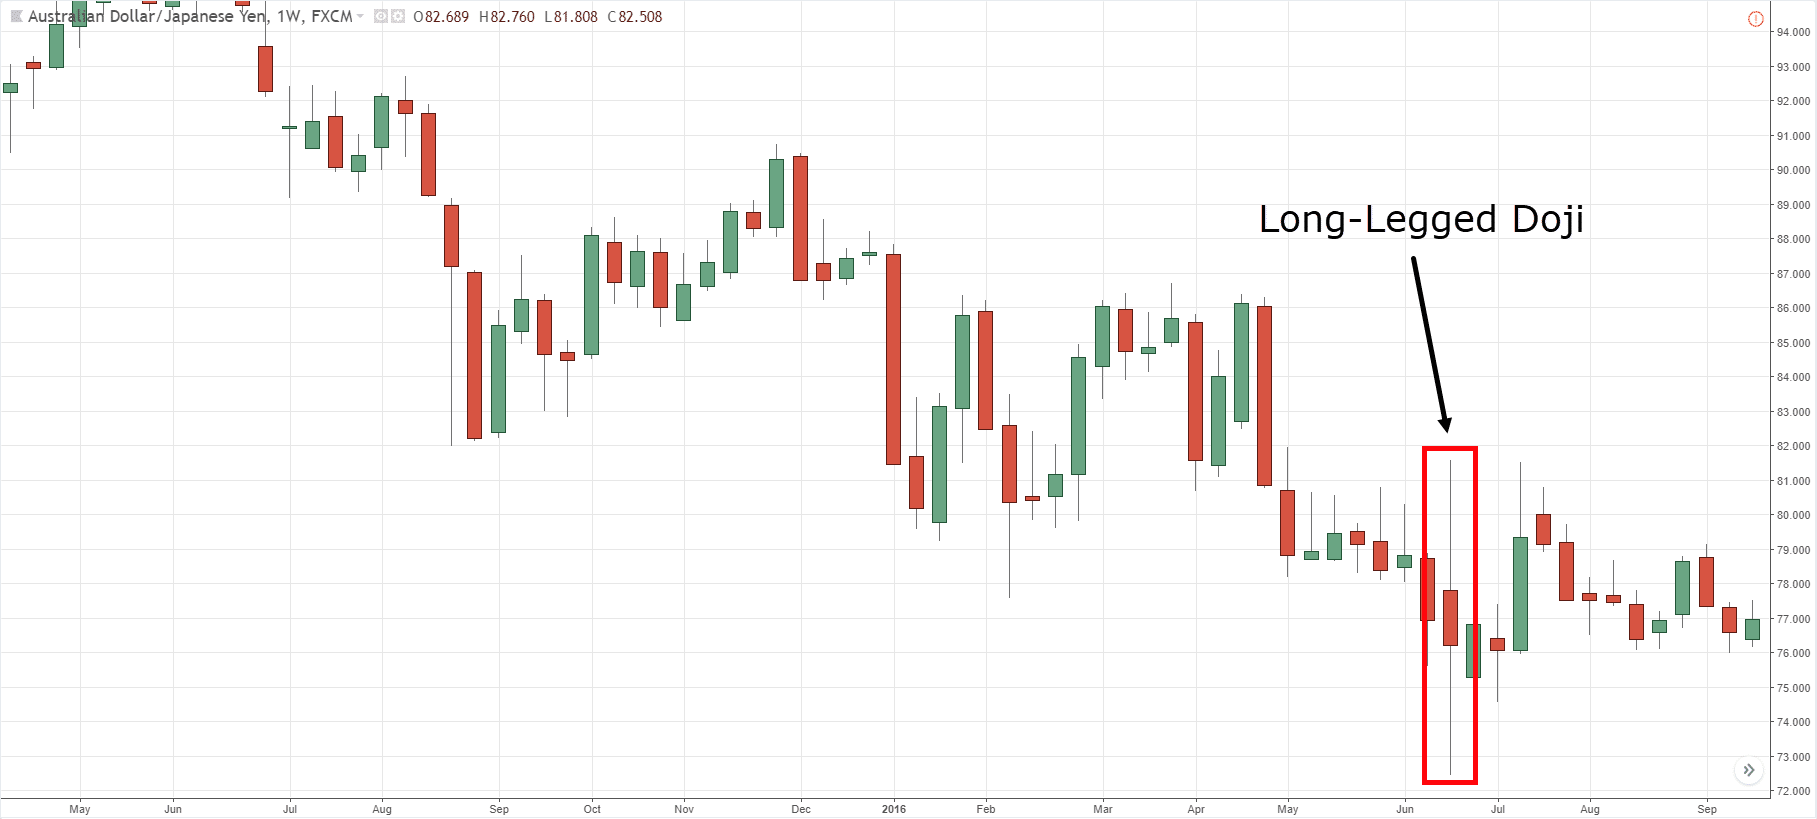
A long-legged doji candle casts extended shadows both up and down. Since this model shows significant market hesitation at the trend high, bearish traders have a greater chance of success.
The price increases significantly at the start of a new trading period before falling. The price eventually returns to the starting point or a level just above it at the end of the time frame.
A candlestick is referred to as a rickshaw if the price is in the middle of the trading range and the shadows are of identical length.
There is another kind of candlestick that has a small body and one or two extremely lengthy shadows. This doji is called a “high wave.”
Gravestone doji
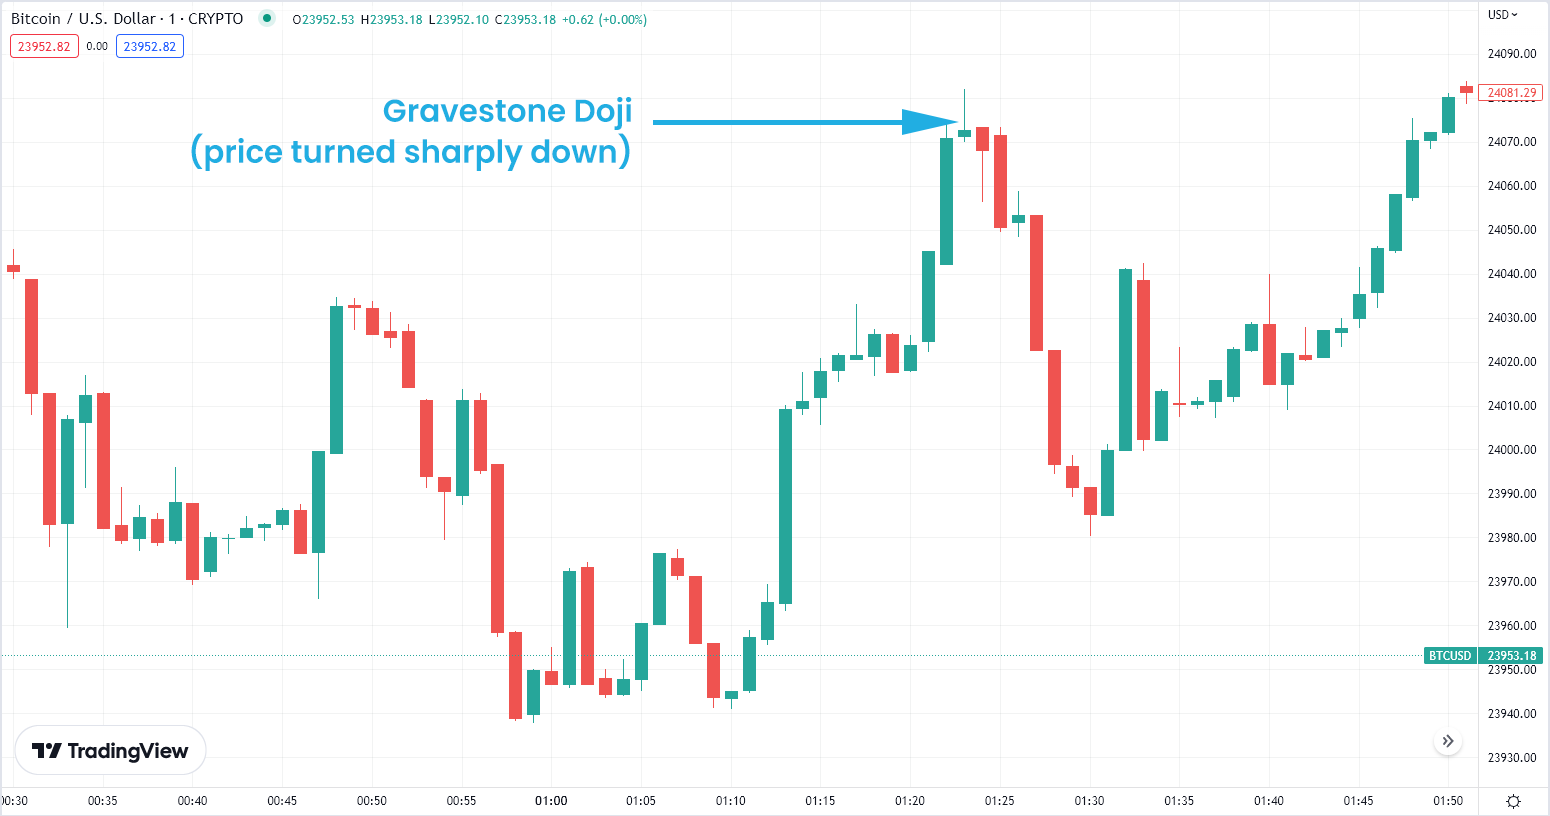
A gravestone doji is a warning that the present trend is reaching its limit and is likely to change direction.
When the open, low, and closing prices are all close to one another with a lengthy upper shadow, a gravestone doji forms, serving as a bearish reversal candlestick pattern.
Bullish traders should be prepared to exit deals since this pattern is a strong signal in an uptrend that forewarns of bearish activity at the levels achieved. A dragonfly doji may also appear at the bottom of a downtrend, although in this instance, further confirmation is required. The strength of the reversal signal increases with the length of the top shadow of the gravestone doji.
Four-price doji
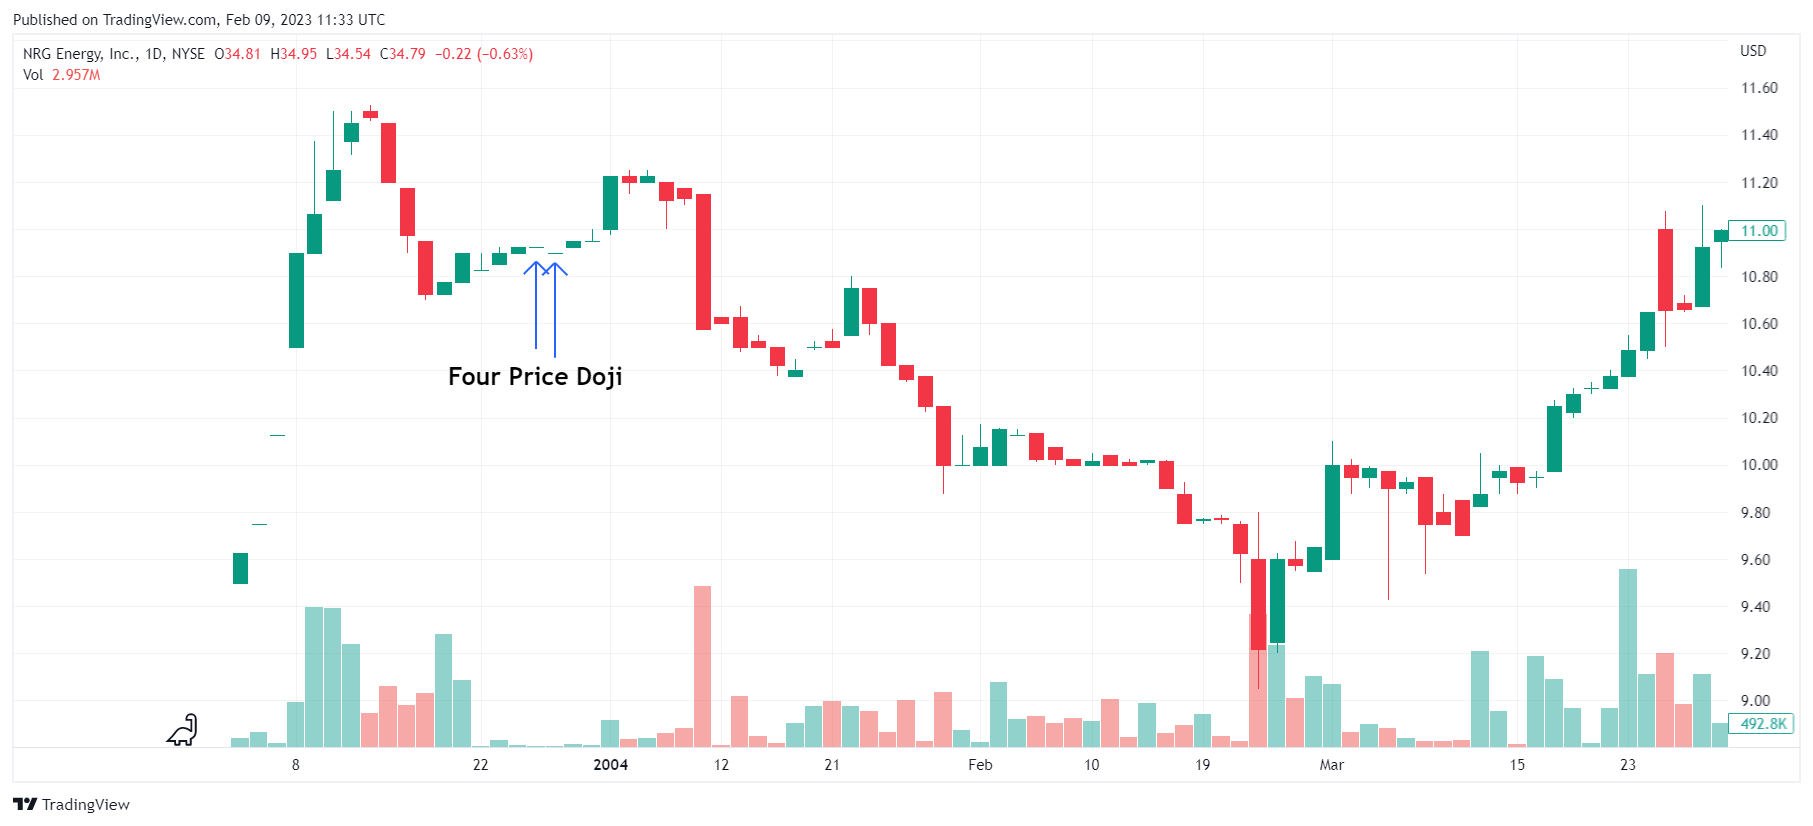
The four-price doji is just a horizontal line: there is neither a vertical line above it nor one below it. Since all the candle's four prices are the same, this pattern denotes the utmost indecisiveness of traders. The four-price doji is a distinctive pattern that, again, denotes hesitation or a very quiet market.
Advantages and disadvantages of a doji candlestick
| Advantages | Disadvantages |
| At the peak of the trend, it gives off strong reversal indications. | It could indicate erroneous moves in the opposing directions, triggering bullish and bearish traps. |
| It denotes market fluctuations, which might be profitable. |
A doji in a downtrend could indicate trend persistence rather than a shift. |
| It maximizes the profit from a single deal when used in periods of an hour or more. |
Due to its high sensitivity to market noise, it is not effective in short time frames. |
What is the difference between a doji and a spinning top?
Candlestick charts make it possible to apply a limited amount of knowledge regarding market patterns, traders’ emotions, momentum, and volatility. Candlestick chart patterns are indicators of these market activities and reactions.
There are distinctions between the two in terms of how technical analysts interpret them, but doji and spinning tops both demonstrate that buying and selling forces are virtually equal.
Doji and spinning tops are quite similar, although spinning tops have bigger bodies and closer opening and closing angles. To be considered a doji, a candle's body typically must make up no less than 5% of the total candle's size range. Anything more turns it into a spinning top.
How to read a doji candlestick
Reading doji candles in candlestick charting involves analyzing the open, high, low, and close prices to determine potential market reversals or indecision. Here's a step-by-step guide to interpreting doji candles.
1) Look at the structure of a doji candle
A doji occurs when the open and close prices are nearly the same or equal, resulting in a small real body or no real body at all. It appears as a cross or a plus sign.
2) Identify the trend
Determine whether the prevailing trend is bullish (upward) or bearish (downward). This context is crucial for interpreting the doji candle's significance.
3) Check the shadows
Observe the length of the upper and lower shadows (also called wicks). Longer shadows indicate greater price volatility, while shorter shadows suggest limited price movement.
4) Consider the size of the doji candle
A small doji after a substantial price move may indicate a possible trend reversal or a consolidation phase.
5) Interpret patterns
Various doji patterns can provide additional insights. For example, a gravestone doji has a long upper shadow and no lower shadow, suggesting a bearish reversal potential.
6) Look for confirmation signals
Don't solely rely on the presence of a doji candle shape. Seek confirmation from other technical indicators, chart patterns, or trend lines to validate your analysis.
7) Take action based on your analysis
Depending on the overall market conditions, the presence of a doji candle may warrant a decision to buy, sell, or wait for further confirmation.
How to use a doji candlestick in trading – Best strategy
Now that you know what doji candles look like and how to read them, let’s get down to the practical part – building trading strategies. Here are two examples: one with a standard doji, and another with a dragonfly doji.
Trading with a standard doji
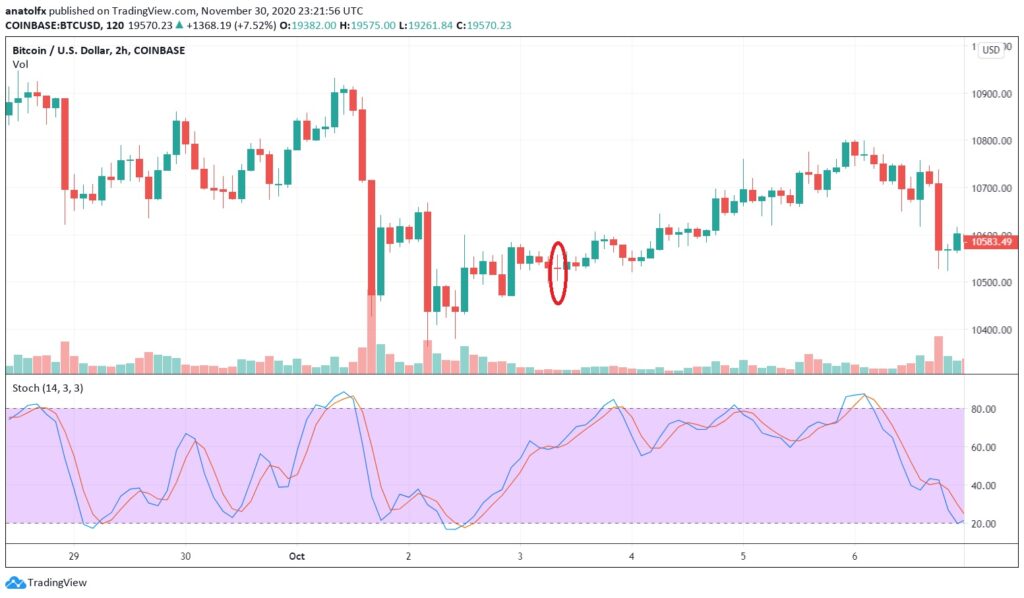
As you can see, the doji candle pattern emerged following a little pullback inside of an uptrend that had just started. Will the price remain in an upward trend or will it start moving downward? We looked at the stochastic in order to get a more precise picture. Given that the price movement is not even near to the overbought level, it suggests that there is still more possibility for growth.
Always check the stochastic or the RSI indicator to receive a better signal when the doji candlestick appears around the resistance of an uptrend or at the bottom of a downturn. Waiting for the next candlestick to break above or below its high or low is the best course of action for trading the doji.
Trading with a dragonfly doji
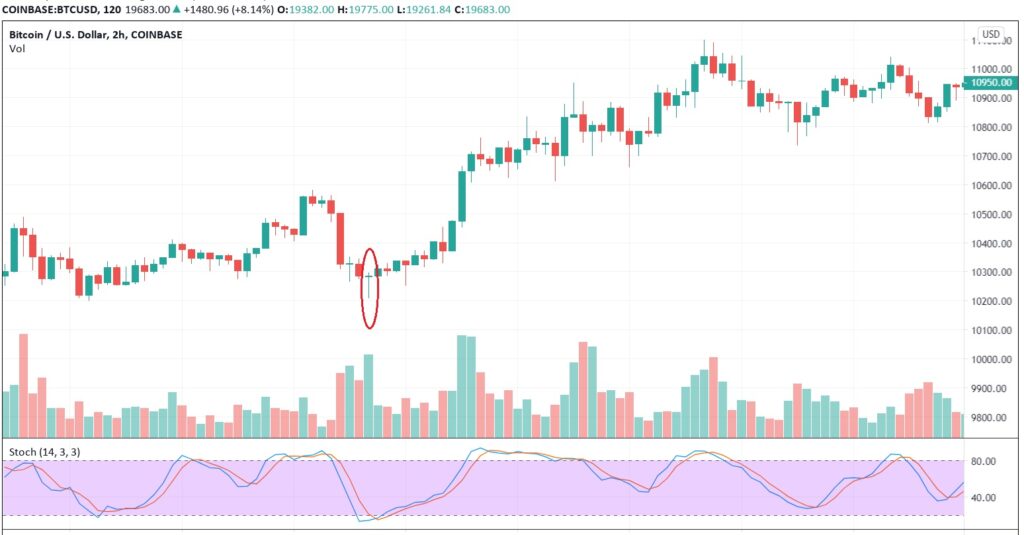
After a sharp bearish fall, the dragonfly doji developed. This particular sort of doji foretells a trend reversal, which also occurred in our scenario. Additionally, after the bearish candle, the stochastic approached the oversold level, suggesting that the dragonfly was even more important. The price eventually began to rise very slowly, and then the rate quickened.
The chart may develop a Gravestone pattern when the price rises over an extended period of time. This is an inverted dragonfly doji that occurs before an uptrend's reversal.
Trading a doji star
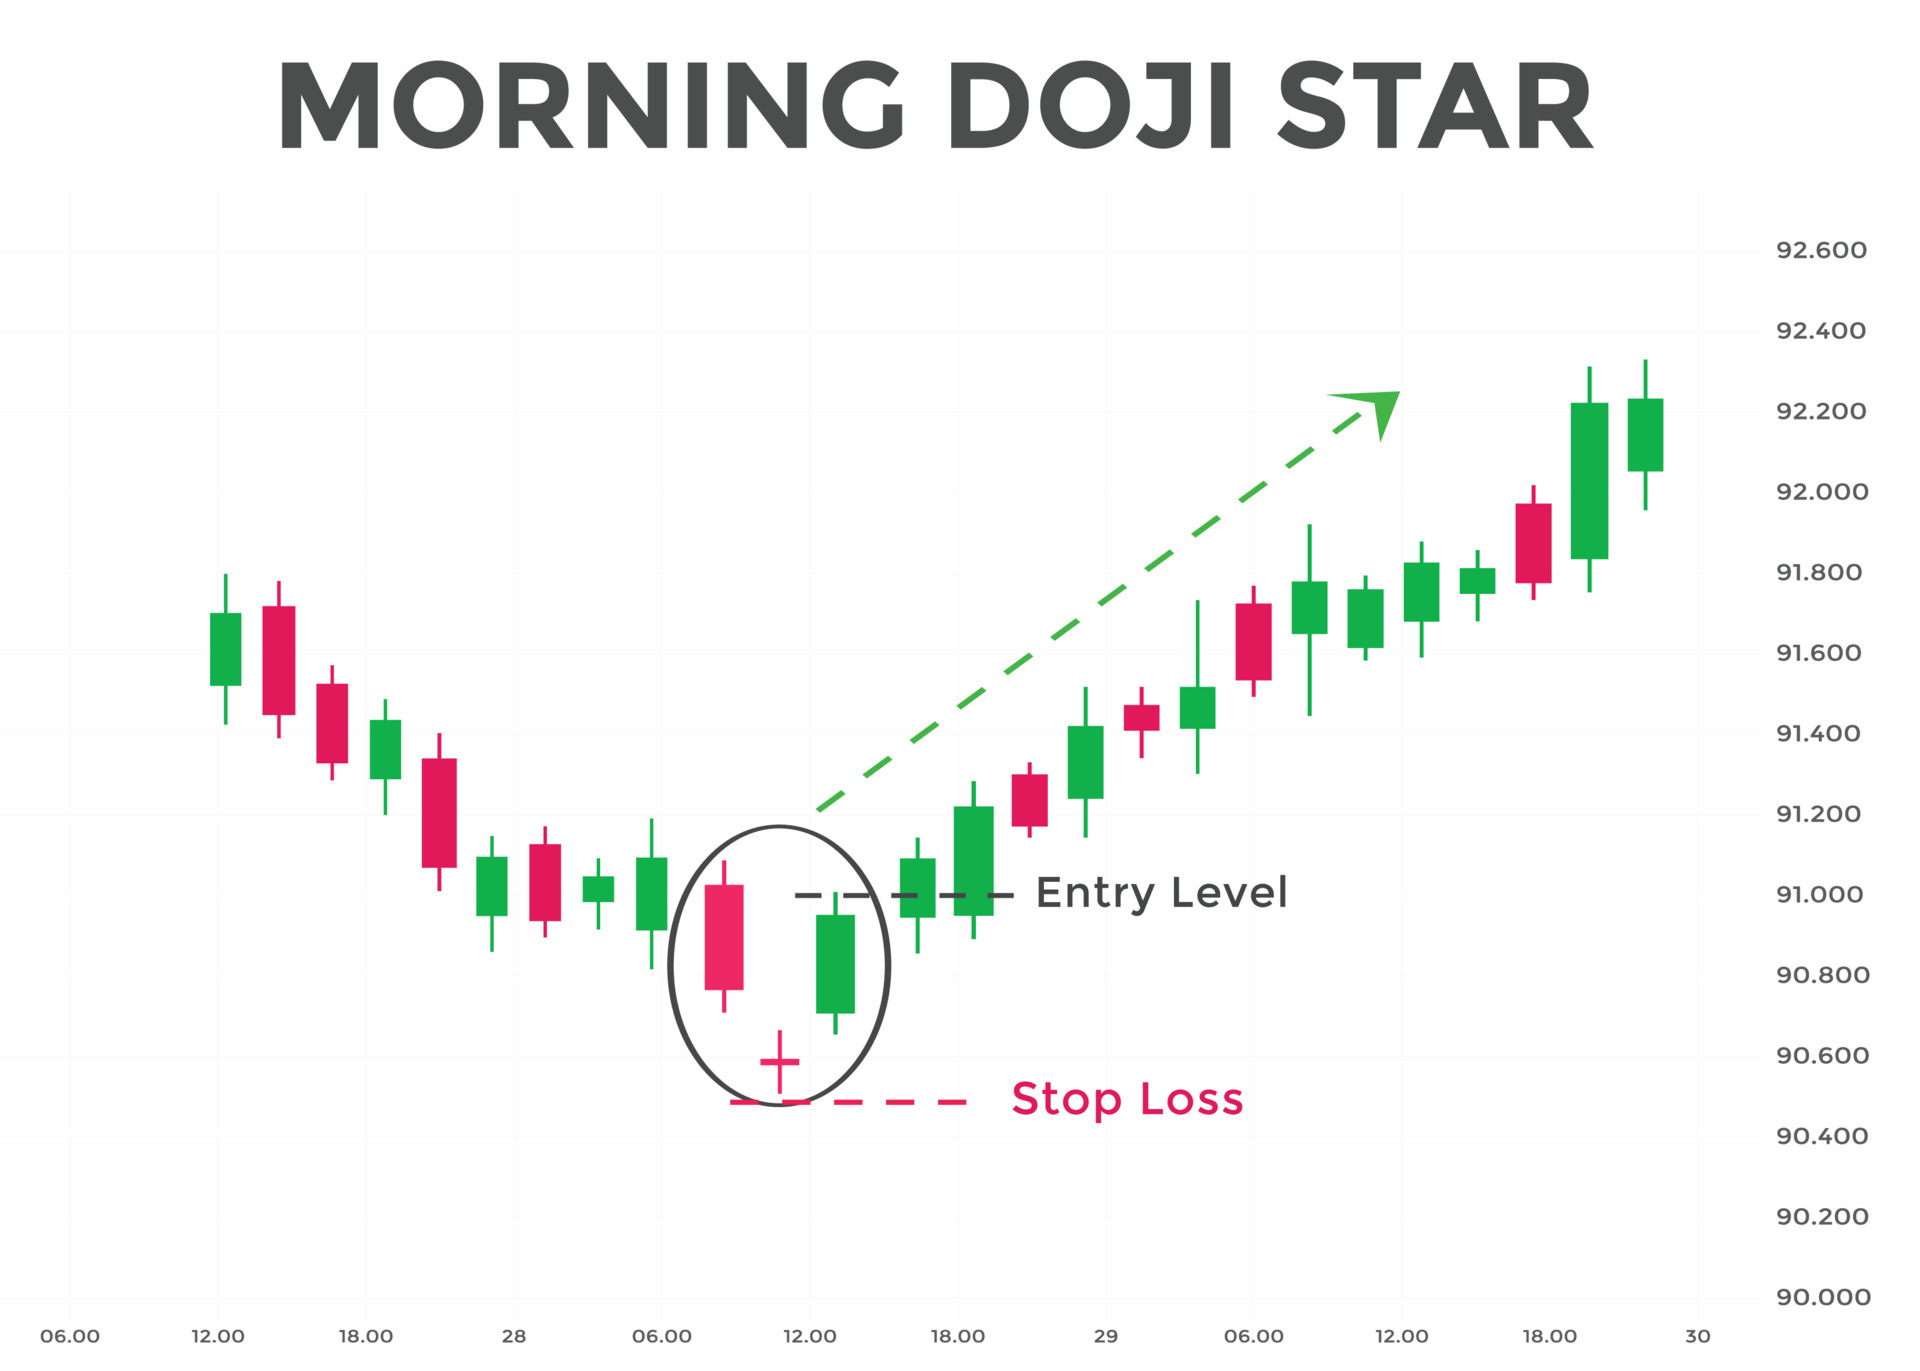
The doji star formation is a candlestick pattern that occurs when a doji appears after a significant price decline. It is characterized by a small or nonexistent body and long upper and lower shadows. The doji star suggests a potential trend reversal or indecision in the market. Look for confirmation from the following candlestick to determine whether the reversal will occur. A doji star at support or resistance levels can carry more significance.
Conclusion
Although they are not reliable when used as a standalone solution, doji candlestick patterns are a great additional instrument for identifying bullish or bearish trends. They are highly recommended for experienced traders who are already familiar with RSI and other indicators. If you want to trade intraday, make sure to use Japanese candles and other methods of chart analysis – it will provide you with a more reliable picture of the market.
FAQ
What does a doji candle mean?
A doji candlestick pattern reflects indecision in the market, with the opening and closing prices being similar or equal. It suggests a potential reversal or lack of direction, prompting traders to closely monitor price action for further confirmation.
What does a red doji candle indicate?
A red doji candle typically indicates indecision or a potential reversal in price direction. It suggests that buyers and sellers are in equilibrium, with neither side having control. Traders often interpret it as a possible sign of a trend reversal.
What does a green doji candle mean?
A green doji candle also indicates indecision or a potential reversal in price direction. It signifies a balance between buyers and sellers, suggesting uncertainty in the market. Traders may interpret it as a possible signal for a trend reversal or a continuation of the current trend.
Where does a doji candle open and close?
A doji candle occurs when the opening and closing prices are very close to each other, resulting in a small or nonexistent body. The exact location of the open and close may vary, but they are typically near the same level.
What happens when a doji candle forms?
When a doji candle forms, it indicates a potential reversal or indecision in the market. Traders see it as a sign that the balance between buyers and sellers is shifting, and it can suggest a trend reversal or continuation, depending on the context.
How to identify a weak doji candle?
A weak doji candle can be identified by its small body and long shadows, indicating a lack of market conviction. It may also have low trading volume and appear in a range-bound market.

