Double Bottom Patterns
)
The double bottom pattern is a pivotal price action indicator in trading. This formation, resembling a "W," signals a potential reversal of a prior down move, offering traders insights into trend direction shifts. Want to learn more about this powerful technical analysis formation? Read on and learn how double bottoms are formed, their key features, trading strategies, and more.
Table of Contents
Key Takeaways
What Is The Double Bottom Pattern?
Double Bottom Pattern Characteristics
Double Bottom Pattern Success Rate
What is the Shake Out +3 Early Entry Technique?
Shake Out +3 Rules
Why Shake Out +3 is Effective
How to Identify a Double Bottom or Top Formation on a Chart
Analyzing Support/Resistance Levels with Double Bottoms/Tops
Example scanners based on Double Bottoms and Tops
Tips to Trade Double Bottoms/Tops Effectively
Understanding Risks Involved in Trading Double Bottoms/Tops
What Does a Double Bottom Tell You?
Example of a Double Bottom
Does the Double Bottom Suggest a Price Target?
Conclusion
FAQs
Key Takeaways
-
Double bottom pattern is a bullish chart pattern that usually indicates the shift from a downtrend to an uptrend.
- It looks like a “W” letter with two low points and one peak in the middle.
- The counterpart of the double bottoms is the double top formation, which indicates the shift from bullish to bearish market sentiment.
- The double bottom formation can be spotted on various timeframes.
What Is The Double Bottom Pattern?
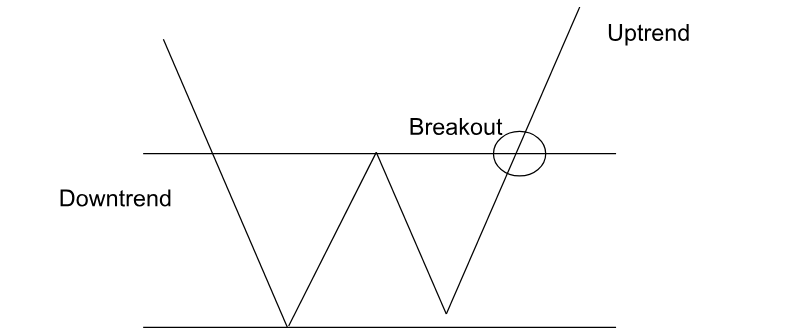
The double bottom chart pattern, which can look like an uneven "W," is a pattern on a trading chart that indicates possible bullish reversals. This formation shows two separate troughs at about the same level, with a peak in between. A buy point is reached when the price breaks through resistance, which is the highest point between troughs and is accompanied by higher volume. Traders see this as a robust sign that the potential trend reversal has lost its strength, indicating a move toward a bullish direction in the market.
Double Bottom Pattern Characteristics
Let’s have a closer look at how the double bottom formation differs from other technical indicators.
- Signal. Double bottoms usually occur after a downtrend and indicate the beginning of the uptrend.
- Base depth. The depth between the two lows reflects market volatility; a deeper base can indicate stronger potential for reversal.
- Volume. Increased volume at the second low compared to the first suggests a growing bullish sentiment.
- Second low. the second through often tests the first one but does not breach it, forming a support level.
- Entry point. Traders tend to open buying positions above the resistance level between the lows, especially if the volume is high.
- Timeframes. Double bottoms can be used across various timeframes, which makes it a versatile tool for different trading strategies.
Double Bottom Pattern Psychology
The psychology behind the double bottom pattern typically represents a "shake out" of weak hands by more resolute, long-term investors. The initial drop frightens less confident traders, while the second drop tests their resolve. Those who hold or buy in times of decline often predict a significant turnaround and position themselves strategically as market sentiment moves toward recovery.
Double Bottom Pattern Success Rate
The effectiveness of the double bottom pattern depends on several factors, such as market volatility, trading volume, and the time frame employed.
- This formation tends to excel in markets with moderate volatility, where distinct trends are easier to identify.
- Increased trading activity at the confirmation point of the pattern typically strengthens its trustworthiness, demonstrating strong buying sentiment.
- Better results are usually seen in longer time frames where market trends are more consistent.
What is the Shake Out +3 Early Entry Technique?
The Shake Out +3 technique, introduced by Jesse Livermore, is an early entry trading strategy commonly for trading double bottom patterns. The idea behind it is buying a stock three points above its first peak between the two troughs. This approach aims to capitalize on momentum before the broader market recognizes the reversal.
Shake Out +3 Rules
When implementing a Shake Out +3 trading strategy, consider these tips:
- Entry point. Buy when the stock price rises three points above the peak between the two lows.
- First low. Ensure the stock does not breach the initial low after entry.
- Volume. Confirm the entry with a significant growth in trading volume.
Why Shake Out +3 is Effective
The Shake Out +3 is an effective technique as it helps traders open positions just as the market confirms a bullish reversal. This way, they can capitalize on the early momentum. The timing in this technique ensures traders are positioned advantageously to maximize gains during the upward trend that often follows a double bottom pattern, as confidence returns to the market.
How to Identify a Double Bottom or Top Formation on a Chart
To spot a double bottom or its counterpart, double top pattern, on a chart, search for two clear troughs (bottoms) or peaks (tops) respectively at approximately the same levels. The gap separating these points forms a neckline or support line. A confirmed pattern appears when the price surpasses the line (for double bottoms) or falls below it (for double tops), usually with higher trading volume. This breakout suggests a possible change in trend, showing a switch from bearish to bullish for double bottoms or vice versa for double tops.
Analyzing Support/Resistance Levels with Double Bottoms/Tops
Double bottom and double top can act as the levels of support and resistance. In a double bottom, the two troughs create a strong support level, indicating where the price is unlikely to fall further. Conversely, a double top forms a resistance level at its peaks, signaling where the price struggles to increase.
Example scanners based on Double Bottoms and Tops
There are many available tools to help traders identify double top and bottom patterns. You can use, for example, TradingView with its customizable scanners to detect these patterns or opt for a robust trading platform, like J2T which will include this and other useful trading tools and indicators.
Tips to Trade Double Bottoms/Tops Effectively
Here are some tips to keep in mind while trading with these indicators.
- Before entering a trade wait for confirmation above the neckline for double bottoms or below for double tops.
- Check if the breakout is accompanied by increased trading volume.
- Identify and stick to key support and resistance levels.
- Set a stop loss below the support level for double bottoms or above the resistance level for double tops to mitigate potential risks.
- Opt for a reliable brokerage platform, like J2T, that offers all the necessary instruments for effective trading.
Understanding Risks Involved in Trading Double Bottoms/Tops
Double tops and double bottoms, while potentially profitable, aren't foolproof and come with inherent risks. False breakouts can mislead traders, resulting in significant losses. Therefore, it’s crucial to implement risk management strategies, such as setting strict stop-loss orders to minimize potential damages to the portfolio. Moreover, it’s recommended to align trades with clear return goals. It will help you maintain focus and discipline.
What Does a Double Bottom Tell You?
Key signals of a double bottom include:
- Support level. Two distinct lows at approximately the same price point form the level of support.
- Trend reversal. A double bottom usually indicates a shift from a downtrend to an uptrend.
- Trading volume. While trading this formation, you will usually note an increased trading volume on the second low, which confirms the increasing buying sentiment.
- Price target. The height between the support level and the peak provides an estimated price target.
Example of a Double Bottom
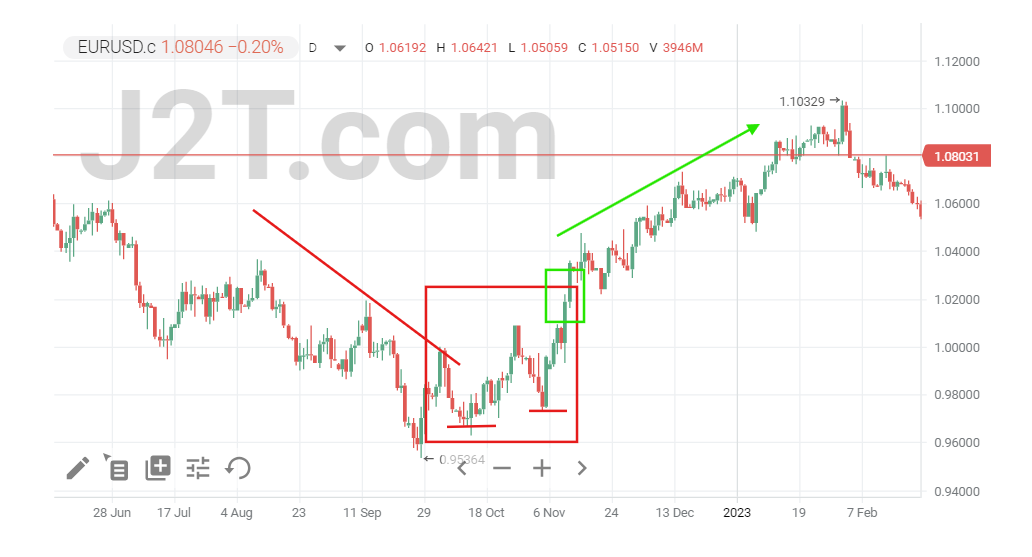
Let’s consider a double bottom example on the EUR/USD trading chart. We can see that the market was experiencing a long downtrend. It reached the first trough, bounced to the peak, fell again to a similar level as the previous low, and started to grow, finally breaking out the resistance level and beginning a robust uptrend movement. Two lows and a pick in the middle formed a double bottom chart pattern, which indicated the reversal of the downtrend and the start of the upward move.
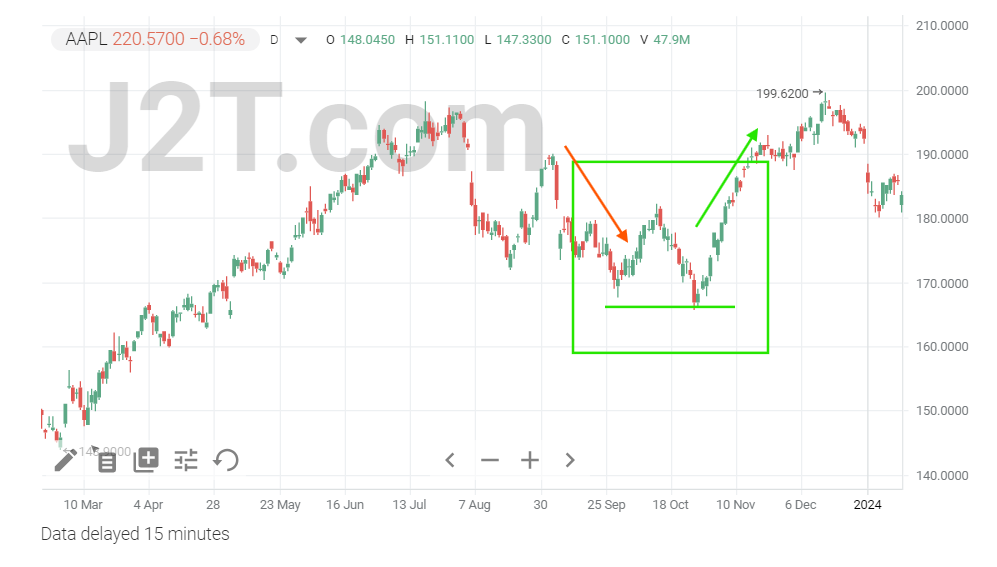
Here is a similar example of the double bottom formation but on the stock price chart.
Must the Two Bottoms of the Lows in the Double Bottom Pattern Be the Same?
The two lows don’t need to be identical. Minor changes are okay as long as they establish a distinct level of support. The crucial factor is the development of two separate troughs indicating a possible change in the trend direction.
Does the Double Bottom Suggest a Price Target?
A double bottom pattern does suggest a minimum price target. This target is calculated by measuring the distance from the previous low to the corrective high in the middle of the formation. Typically, this indicates around a 10% rebound from the initial low, helping traders estimate the upside potential and set informed profit targets.
Conclusion
The double bottom pattern is a technical analysis tool that provides valuable insights into price movement and market sentiment. By combining this reversal pattern with other technical indicators, traders can enhance their analysis and decision-making processes. Understanding these patterns and their consequences leads to better decision-making in entering and exiting trades, ultimately enhancing trading performance and results.
FAQs
Is the double bottom pattern bullish?
The double bottom formation is a bullish reversal pattern. It suggests a potential change from a downtrend to an uptrend, meaning the stock's price might rise after forming two separate low points.
What is an example of a double bottom?
A double bottom occurs when an asset price experiences a sharp decline to a price level, rebounds, falls to the same level again, and then rises. The whole formation looks similar to the letter "W."
What is the success rate of the double bottom pattern?
The effectiveness of the double bottom pattern depends on various factors, such as market conditions and trading volume.
What is double bottom pattern code?
The code for the double bottom pattern involves the technical identification of specific criteria in charting software, such as price level, two troughs, and a breakout point above the middle peak.
Is double bottom bullish or bearish?
The double bottom is bullish. It signals a potential reversal from a bearish downward trend to a bullish upward trend. The double top pattern, in turn, is a bearish indicator.
How do you find the double bottom pattern?
To find the double bottom chart pattern, look for two distinct troughs at a similar price level on a chart, separated by a peak. Confirm the pattern with increased trading volume and a breakout above the horizontal line of the peak.
When should I buy a double bottom pattern?
Traders tend to open buying positions at the breakout point of the double bottom pattern, where the asset’s price moves above the peak between the two troughs.