Elliott Wave Theory

Table of Contents
What Is the Elliott Wave Theory?
Key Takeaways
What Is the Elliott Wave Principle?
What Is the Background History of the Elliott Wave Theory?
Basic Sequence
How Can I Apply the Elliott Wave Principle?
How to Use Elliott Wave Theory in Technical Analysis
What Is the Advantage of Elliott Wave Theory?
What Are the Limitations of Elliott Wave Theory?
Bottom Line
FAQs
The Elliott Wave Theory is a method used in technical analysis to analyze price movements of assets in financial markets. Created in the 1930s by Ralph Nelson Elliott, this theory suggests that market data follows recognizable patterns, referred to as "Elliott waves," influenced by the psychology of traders.
This guide will examine Elliott Wave Theory in detail, covering its fundamental principles, applications, advantages, and drawbacks. Learning how this strong method operates will assist beginners and financial professionals in predicting market patterns and pinpointing potential turning points with greater efficiency. Keep reading to discover additional information.
What Is the Elliott Wave Theory?
The Elliott Wave Theory is a technical analysis tool. It suggests that assets prices tend to follow a pattern that looks like waves, going up and down in a predictable way. According to this theory, these movements are driven by the sentiment of traders and investors, hesitating between being optimistic and pessimistic.
The Elliott Wave pattern breaks down these waves into smaller sequences. Typically, there are five "up" waves, where prices increase because market participants are feeling positive, followed by three "down" waves, where prices drop due to negative sentiment.
Traders often use this approach to forecast future price trends across diverse real-world markets, such as stocks, commodities, and forex.
Key Takeaways
-
Elliott’s Wave Theory analyzes price movements based on recognizable wave patterns driven by market mass psychology.
- It is commonly represented by a five-wave structure moving in the direction of the main trend, followed by three corrective waves.
- Elliott’s Wave Theory was developed by Ralph Nelson Elliott in the 1930s.
- Wave patterns and Fibonacci ratios help forecast market turns and set price targets.
- It integrates technical analysis with psychology to gauge shifts in market sentiment.
- Wave counting is subjective, requiring skill to apply the theory accurately.
What Is the Elliott Wave Principle?
The principle behind the Elliott Wave Theory reveals the psychological patterns behind market movements. It suggests that investor psychology naturally oscillates between pessimism and optimism, this way forming predictable patterns in market prices.
This principle is most noticeable in financial markets, where changes in investor attitudes result in variations in stock prices. Analyzing these recurring patterns allows analysts to identify the current stage of the market and forecast its probable future trajectory.
Fundamentally, the Elliott Wave Theory suggests that markets respond inconsistently to external events. For example, news that may cause prices to rise today could have the opposite effect tomorrow. This inconsistency indicates that market movements are mainly influenced by the collective mood of investors rather than external factors.
As already mentioned above, the theory describes market cycles as unfolding in waves, each representing a different stage of investor sentiment. Analysts use these wave patterns to estimate the likelihood of future price changes and to make strategic trading decisions. For example, in a bull market, prices are typically driven up by investor optimism, leading to a pattern of impulsive waves rising, with short corrective waves in between. During a bear market, investor negativity leads to price declines, following a consistent trend.
What Is the Background History of the Elliott Wave Theory?
)
Ralph Nelson Elliott introduced the Elliott Wave Theory in the late 1930s. Elliott, a former accountant, began a quest to understand the enigmas of market conduct.
After carefully analyzing stock market data for over 75 years, Elliott discovered distinct patterns and recurring cycles in price movements. His discoveries went against the commonly held idea that market fluctuations were arbitrary and couldn't be foreseen.
In 1935, Elliott made a significant advance by correctly forecasting the conclusion of a long market downturn. His examination, relying on his concept of the "Wave Theory," allowed him to identify the exact moment when a market shift would occur with exceptional accuracy.
Intrigued by this achievement, Charles J. Collins, a well-known investment advisor, teamed up with Elliott to release the influential book, "The Wave Principle," in 1938. This book established the basis for Elliott’s Wave Theory and how it can be used in analyzing markets.
Over the years, Elliott further developed his theory by integrating the Fibonacci ratio—a mathematical concept found in nature—to explain the proportions and connections in the market patterns that were observed.
Elliott's innovative research questioned traditional beliefs and offered a structure for comprehending the complex workings of market psychology, which influences stock price movements. Thousands of portfolio managers, traders, and investors all over the world still rely on the Elliott Wave Principle for making investment decisions, proving that his influence lives on.
Basic Sequence
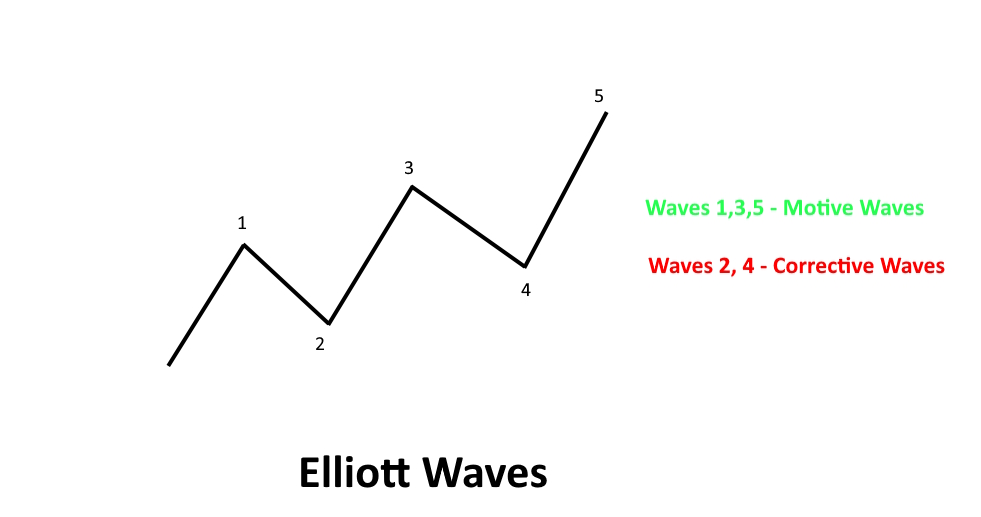
The fundamental pattern in Elliott Wave Theory is composed of eight waves: five waves that push in the same direction as the main trend, followed by three waves that usually go against it. This pattern enables analysts to predict both the persistence and the change of trends.
Motive Waves
-
Wave 1 initiates the pattern and is typically smaller and less noticeable. It symbolizes the first step towards the broader trend, as some investors begin to see a possible opportunity.
- Wave 2 is a corrective wave that goes in the opposite direction of the trend and retraces part of Wave 1. It does not go beyond the beginning of Wave 1 and frequently falls back to 61.8%, following the Fibonacci ratio.
- Wave 3 is frequently the lengthiest and most formidable wave, demonstrating a significant push forward due to the widespread acknowledgment of the market's trend. Generally, it typically continues past the conclusion of Wave 1 by a Fibonacci factor.
- Wave 4 is a corrective wave that usually retraces a smaller amount than Wave 2 while still keeping the trend's momentum. The price territory of Wave 1 should not be breached.
- Wave 5 is the last impulsive wave, characterized by prices surging to fresh highs, typically driven by excitement. It is typically smaller than Wave 3 and can occasionally develop in divergent conditions with signals.
Diagonal Waves
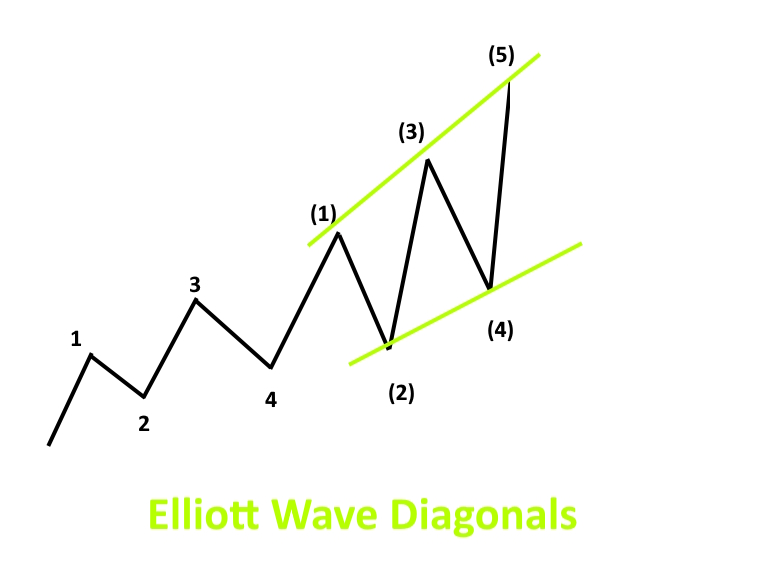
Diagonal waves, a type of impulsive waves, appear at the start of Wave 1 or A, and the end of Wave 5 or C. Unlike regular impulsive waves with separate waves, diagonals have overlapping waves. Diagonals can be divided into two categories: ending diagonals and leading diagonals, both of which play a crucial role in indicating market fatigue and possible reversals.
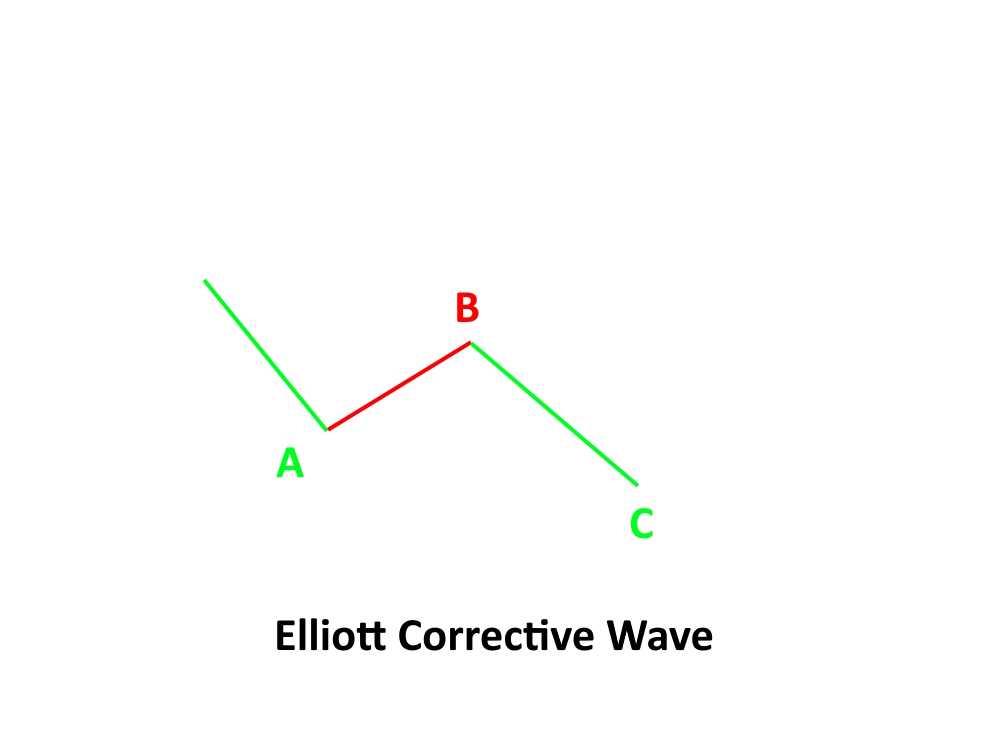
Corrective Waves
-
Wave A is the initial correction wave, counteracting the primary trend. It has the potential to be cutting and significant, diminishing certain profits from Wave 5.
- Wave B usually retraces Wave A by a smaller percentage, sometimes reaching a slightly higher or lower point, causing confusion among traders regarding the market's direction.
- Wave C is the last part of the correction phase, and moves sharply in the same direction as Wave A, often extending past the end of Wave A.
The corrective phase, composed of Waves A, B, and C, forms a three-wave structure that corrects the preceding five-wave impulsive sequence. This structure is essential in Elliott Wave analysis as it helps determine the completion of a three-wave correction and the potential resumption of the larger trend.
How Can I Apply the Elliott Wave Principle?
The Elliott Wave Principle is a powerful tool that provides a roadmap to navigate the intricate patterns of market behavior. In this section, let’s examine how Elliott waves can be applied to trading to help you identify potential turning points and, as a result, make more informed decisions.
-
Identify the wave pattern. The first thing to remember is that Elliott’s Wave Theory differentiates between impulsive and corrective waves in market price fluctuations. Impulsive waves are usually made up of five smaller waves that push the market in the direction of the trend. Corrective waves, which come after, are composed of three smaller waves and move in the opposite direction of the trend.
- Analyze the pattern. Once you recognize the Elliott waves, you can use this pattern to make strategic decisions. For instance, if you notice that the market has finished the third wave of an impulsive sequence, you could predict a fourth corrective wave. One possible approach is to wait to buy until the corrective wave is finished, then enter a position as the fifth wave starts to take advantage of the increasing market.
- Use Fibonacci ratios. Market analysis using Elliott waves is strongly connected to Fibonacci ratios in order to identify possible points where a reversal may occur in the waves. For example, it is typical for the second wave in an impulsive sequence to retract up to 61.8% of the first wave. You can use Fibonacci tools to help you determine the reversal points and then use them to improve entry and exit strategies. This technique enhances the accuracy of your trading choices and synchronizes them with the organic patterns of the market.
Let’s consider a practical scenario involving the stock market. Suppose a trader notices that a stock is forming what appears to be the start of an impulsive wave. The stock price rises sharply (Wave 1), dips slightly (Wave 2 without falling below the start of Wave 1), and then surges to new highs (Wave 3). By recognizing this pattern, the trader can predict with greater confidence that after a brief correction (Wave 4), another rise (Wave 5) is likely. This is the ideal point to consider taking a position if the trader has not already done so after the second wave.
In forex trading, the application of Elliott's Theory might look slightly different, but follows the same principles. If a currency pair shows a strong downtrend that completes a five wave pattern, a reversal is likely. Here, understanding that the market moves in cycles, the trader might prepare for a potential bullish correction. The trader can use Fibonacci ratios to anticipate the end of the corrective phase, and set up for the next impulsive wave in the opposite direction.
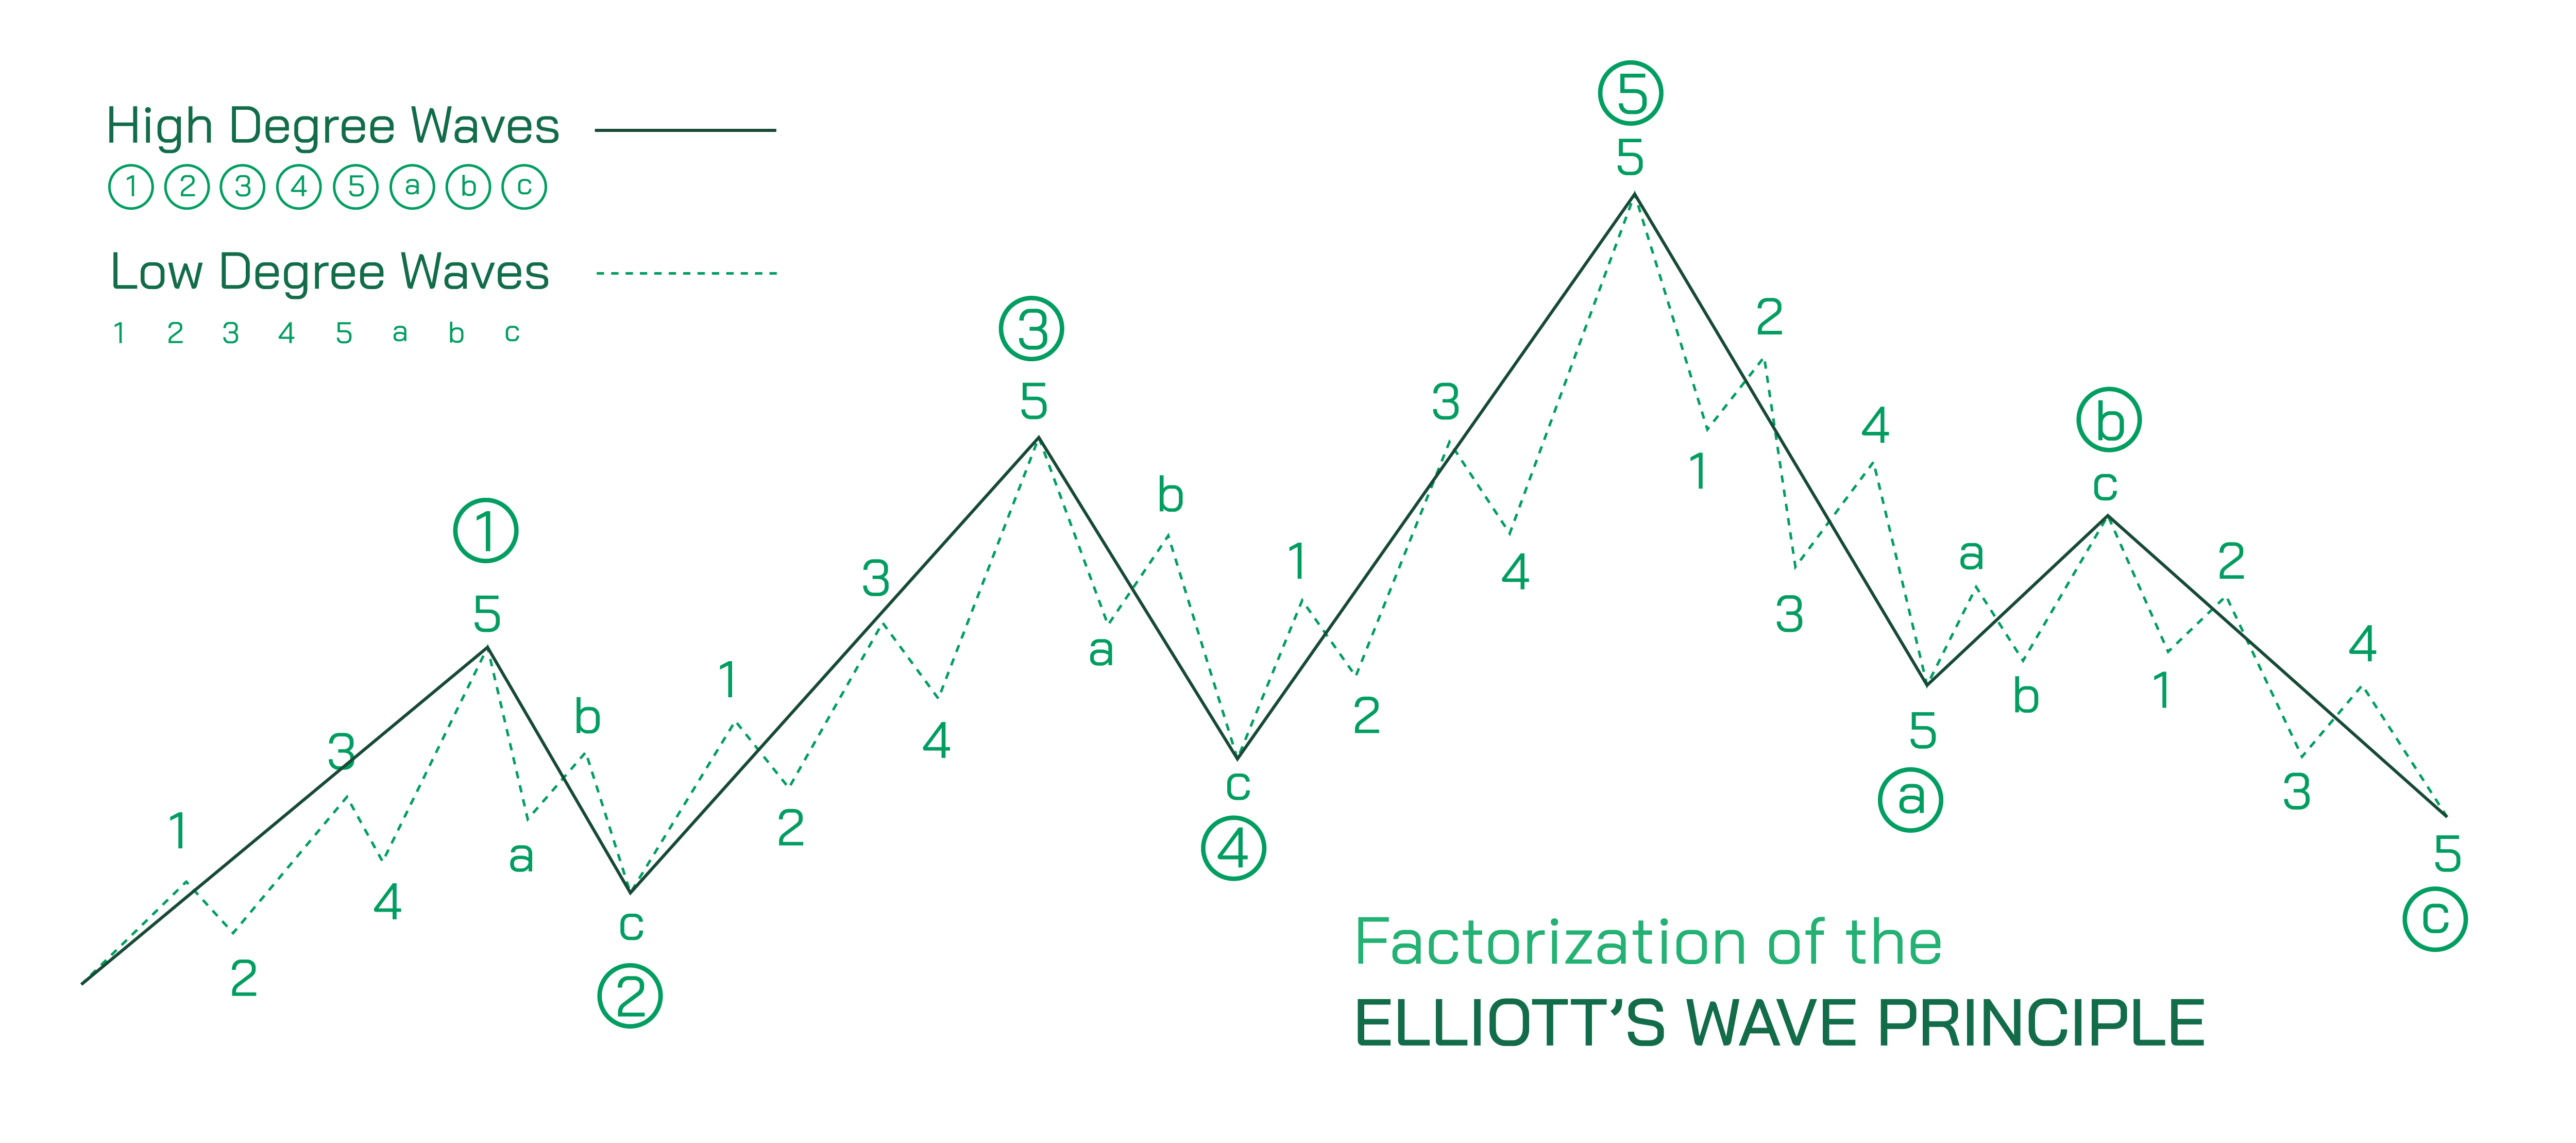
More experienced traders can delve deeper into wave degrees—variations in the scale of waves, from grand supercycles lasting centuries to minuscule waves that may last only minutes. By understanding the context provided by different wave degrees, traders can align their trading tactics with both short-term opportunities and long-term trend predictions.
Another important point about Elliott Wave analysis is its ability to gauge investor sentiment and psychological factors influencing market movements. By analyzing waves, traders can sense shifts in market psychology—switching from optimism to pessimism and vice versa. This can be especially useful in volatile markets, where psychological factors often outweigh other influences.
How to Use Elliott Wave Theory in Technical Analysis
Recognizing patterns in a price chart, specifically the five-wave impulsive pattern and the three-wave corrective pattern, is essential when applying Elliott Wave Theory. However, for a more dependable analysis, here are some helpful tips to keep in mind:
-
Integrate Elliott Wave analysis with other technical indicators. For example, RSI or MACD can confirm the robustness and longevity of the trends recognized through wave patterns. This method using multiple indicators helps in verifying the beginning and end of market movements, offering a more defined trading sign.
- Look for reversal candlestick patterns occurring at the conclusion of a five-wave pattern. These patterns, such as doji, hammer, or engulfing pattern, may indicate a possible change in market direction. Examining the candlesticks on the price chart at important moments, such as the end of a Wave 5 or C, can provide useful entry or exit signals, supporting choices based on wave analysis.
What Is the Advantage of Elliott Wave Theory?
Elliott Wave Theory offers distinct advantages for technical analysts seeking an edge in forecasting market trends. While no method is perfect, understanding the key benefits of Elliott Wave analysis can strengthen your overall trading approach.
-
Identifies the main trend. Elliott Waves distinguish the larger directional trend (three impulse waves) from pending corrections. This clarifies if the price is advancing the main trend or just temporarily retracing.
- Provides context. Wave patterns signify whether the market is beginning a new trend or simply continuing an existing move. This context guides positioning and risk management.
- Projects price targets. Defining the active wave degree allows for projecting precise price targets for an impulse or correction based on common wave retracement relationships.
- Confirms other signals. Elliott Wave patterns can be combined with technical indicators like RSI to bolster trade signals. For example, a completed correction at a potential support level accompanied by a bullish RSI divergence increases conviction in a newfound uptrend.
- Manages trades. Wave rules help identify high-probability entries and exits while avoiding fighting the main trend. This facilitates trades capturing the bulk of sustainable price moves.
What Are the Limitations of Elliott Wave Theory?
While Ralph Nelson Elliott's discovery provides traders with a powerful analytical framework, it's important to understand the limitations of Elliott Wave Theory:
-
Subjectivity. Wave counting is open to interpretation based on the trader's judgment of market data. Faulty analysis can result in incorrect forecasts and trades.
- Flexibility. The stock market's complexity means Elliott's rules require flexibility in their practical application, reducing the theory's definitive nature.
- Assumption of cycles. The theory assumes alternating cycles of impulsive and corrective waves persist. During periods of prolonged trendless prices, Elliott's patterns can be complicated to identify.
- Complicated to understand. Elliott waves exist across multiple degrees (Grand Supercycle down to Subminuette) simultaneously, challenging the user’s ability to discern the operative degree.
- Trend changes. Wave theory describes price action better after a trend change has occurred versus anticipating trend reversals in advance.
Elliott Wave Theory provides valuable insights, but traders must account for its shortcomings through skillful application of complementary technical tools.
Bottom Line
While technical analysis encompasses numerous tools and techniques, Elliott Wave Theory stands out for its ability to discern price patterns and anticipate future market moves. By identifying impulse waves in the direction of the larger trend and corrective waves against it, traders can position themselves accordingly. However, wave counting requires skill, and should be combined with other technical indicators to increase confidence in trade signals.
Elliott Wave analysis serves as a powerful framework for understanding crowd psychology and the dynamics driving evolving market trends. Grasping its advantages and limitations allows traders to harness the insights of this methodology while avoiding its potential pitfalls. When applied judiciously alongside complementary strategies and technical tools, the Elliott Wave Principle can elevate trading results through improved trade timing and alignment with overarching price movements.
FAQs
How Accurate is the Elliott Wave Theory?
Elliott’s Wave Theory, Ralph Nelson Elliott's discovery, offers a structure for interpreting market trends and forecasting upcoming market actions. The accuracy of Elliott Wave analysis relies heavily on the analyst's ability to accurately interpret wave counts and market context.
What Is an Example of Elliott Wave Theory?
An example of Elliott Wave Theory in action is observing a stock price that initiates a rally, undergoes a pullback, and then surges in a larger, more vigorous wave. This pattern shows an impulsive wave at the start, then a corrective wave, and finally another impulsive wave.
What Do the Critics Say About Elliott Wave Theory?
Critics believe Elliott Wave analysis is subjective, susceptible to interpretation problems, and lacking in empirical evidence.
Is Elliot Wave Bullish or Bearish?
The Elliott Wave Principle is neither inherently bullish nor bearish. Its main goal is to pinpoint likely movements in market prices, whether they go up or down, by analyzing wave patterns that have been observed.
Is It Hard to Learn Elliott Wave Theory?
Mastering Elliott Wave analysis requires dedicated study and practice, as it involves recognizing complex wave patterns.