Exponential Moving Average (EMA)

The Exponential Moving Average (EMA) is a crucial technical indicator that gives traders a better understanding of price changes in various markets. This essential element of technical analysis gives more weight to recent price information, making it react quicker than simpler alternatives.
In this article, we will have a closer look at the definition of EMA and its key features, find out how to calculate this indicator and implement it in trading. Understanding EMA can greatly improve your market analysis, guiding when to enter or exit trades, whether you are perfecting your trading strategy or beginning anew. Read on to discover the real-world uses of EMAs and their impact on your trading strategies.
Table of contents:
Key Takeaways
What is Exponential Moving Average (EMA)?
How Exponential Moving Average (EMA) Works
Formula for Exponential Moving Average (EMA)
How To Calculate EMA?
Applications of the Exponential Moving Average
What Are The Advantages Of EMA?
What Are The Disadvantages Of EMA?
Bottom Line
FAQs
Key Takeaways
-
Exponential Moving Average (EMA) is a technical analysis indicator that gives more weight to recent asset prices and therefore is more sensitive to price action.
- EMA is a lagging indicator, thus it is used to validate market trends that have already started.
- This indicator can be used on various timeframes, both short-term and long-term trades.
- Just as with any other indicator, it’s recommended to implement EMA in combination with other technical tools to get a clearer picture of the market and make more robust decisions.
What is Exponential Moving Average (EMA)?

The EMA is commonly used in technical analysis to track the price movement of a security over a set period. The EMA differs from the simple moving average by placing greater emphasis on recent data, increasing its sensitivity to new price movements while weighting all data points equally. This aspect is especially beneficial for traders looking to take advantage of short-term price trends.
The main purpose of the EMA is to eliminate random price fluctuations and offer a clearer picture of the trend by smoothing out price data. A smoothing factor is used on the latest closing prices to create a line that traces the asset's price changes closely. This line can increase or decrease, showing a rising EMA during an upward trend or a falling EMA during a downward trend.
For example, think about the performance of Apple’s stock over a three-month timeframe. The EMA line, typically shown in blue on graphs, tracks the average price during this timeframe, adjusting rapidly to changes because it gives more importance to recent prices.
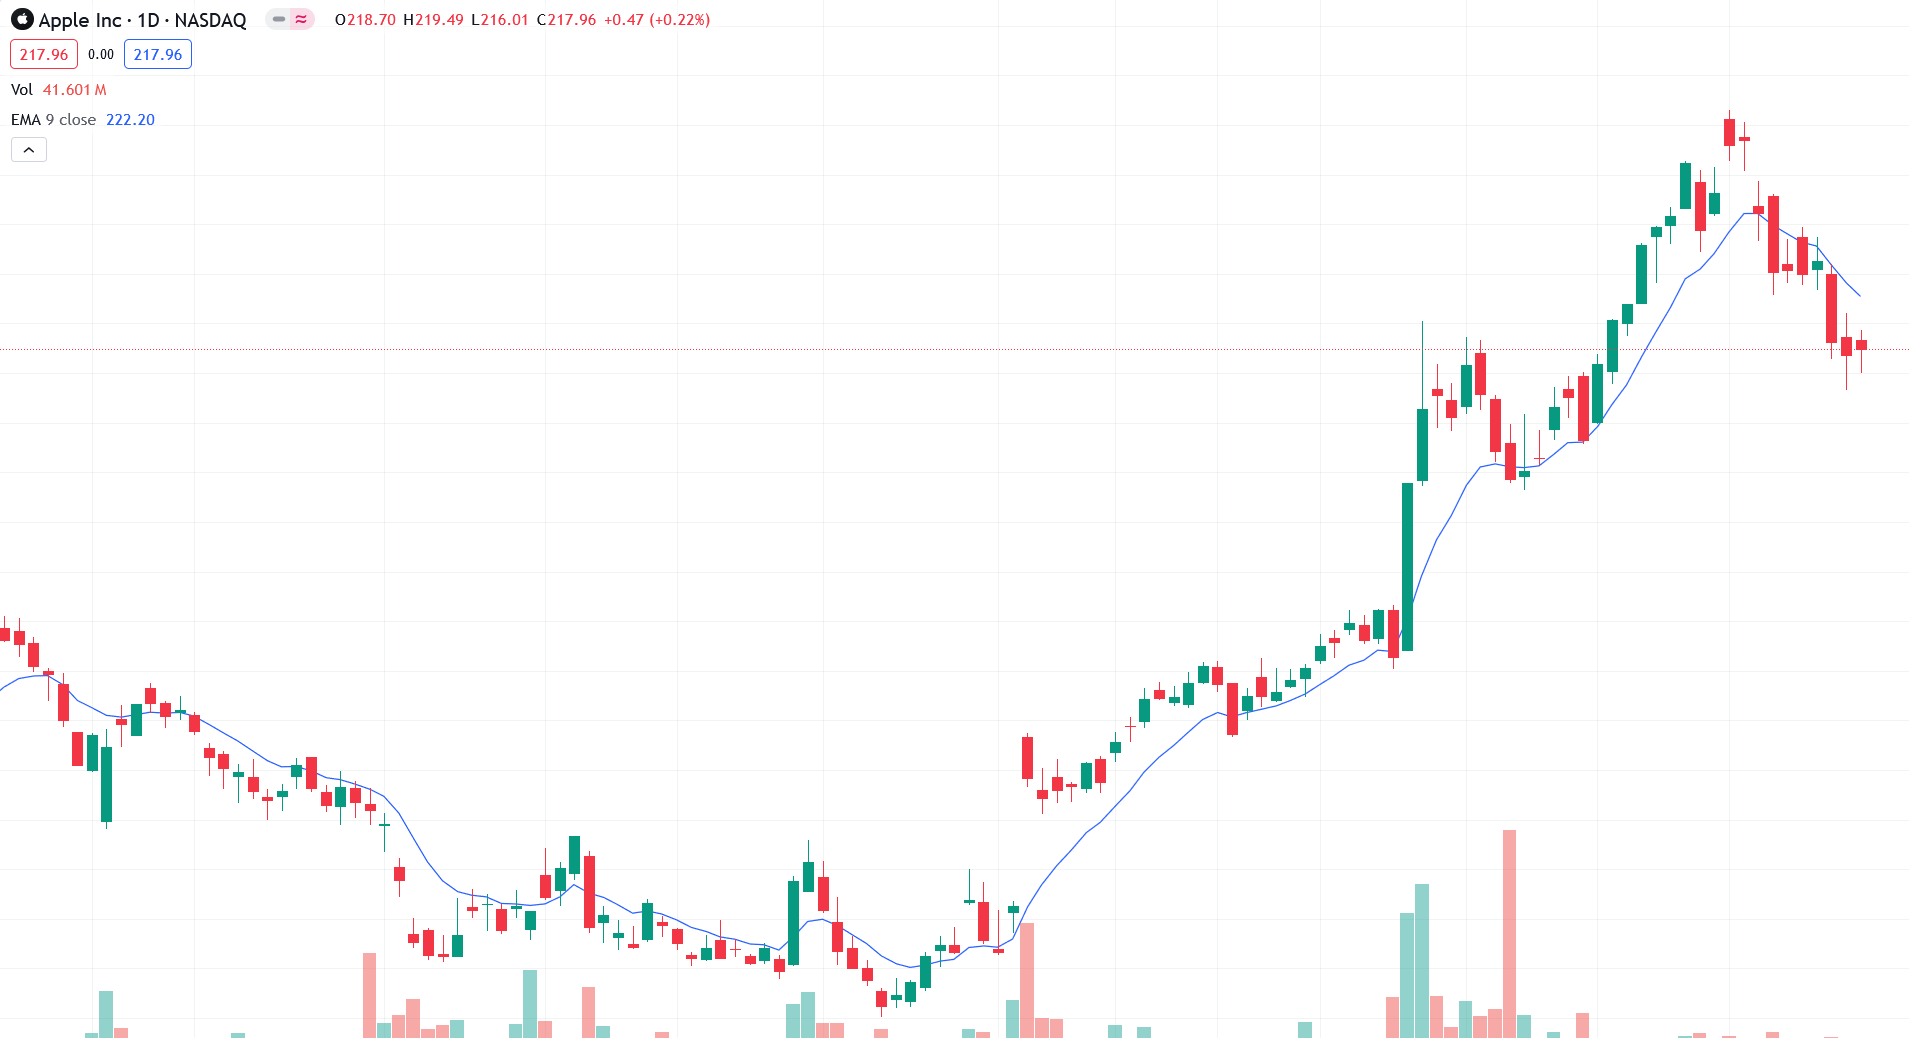
An increasing EMA may indicate an upward trend in the stock, whereas a decreasing EMA could signal a downturn. Traders frequently combine the EMA with other technical indicators like the MACD to produce signals for buying and selling. It is important to understand that shorter EMAs react more quickly to price changes, while longer EMAs offer a more reliable indication of the trend.
How Exponential Moving Average (EMA) Works
The Exponential Moving Average (EMA) prioritizes recent price data by applying a weighted multiplier, making it more responsive to new market information. This sensitivity helps traders identify trends faster, offering a dynamic tool for analyzing market movements.
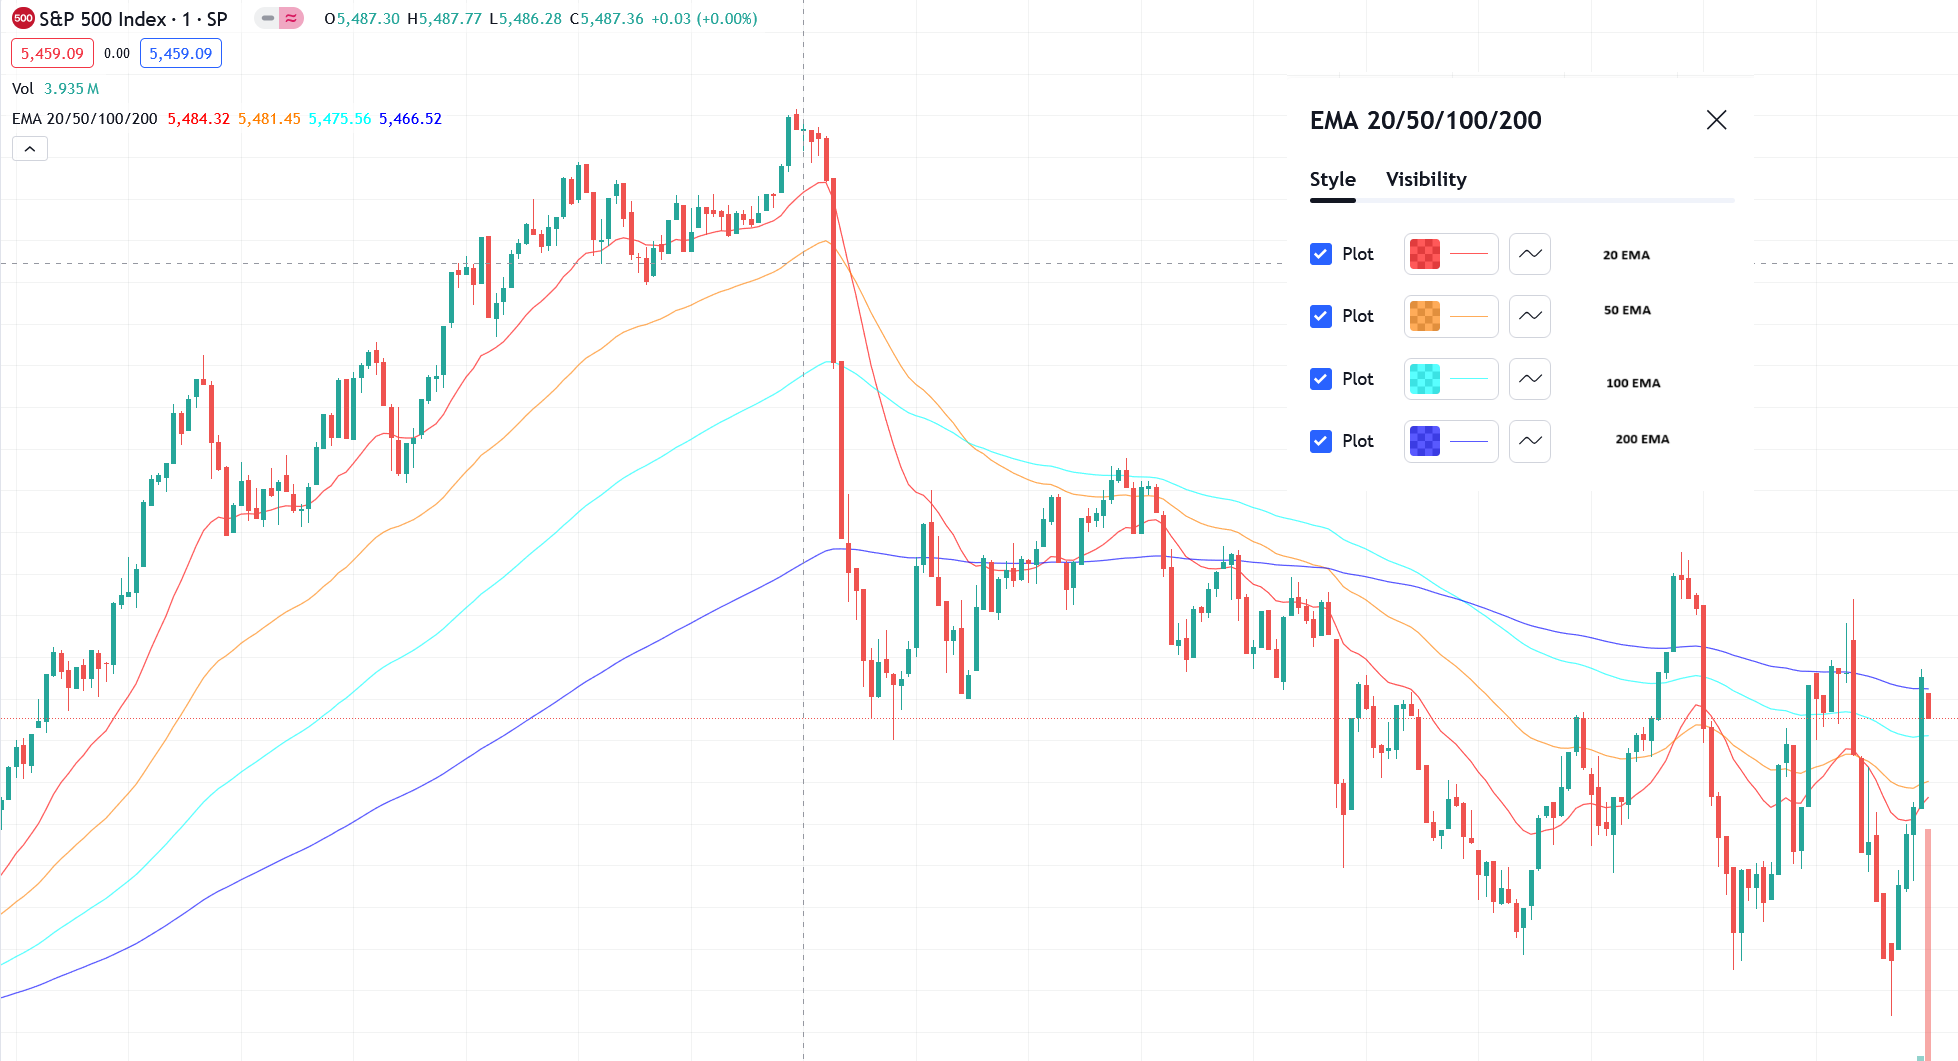
Different durations of Exponential Moving Averages (EMAs), including 20, 50, 100, and 200 periods, are used to analyze price fluctuations across various timeframes. The 20-day EMA reacts swiftly to short-term trading changes, while the 200-day EMA indicates long-term trends. These Exponential Moving Averages are not just for identifying possible levels of support and resistance, but they are also commonly combined with other technical indicators such as the Moving Average Convergence Divergence (MACD) to improve the precision of trading choices.
How Important is Exponential Moving Average (EMA) in Technical Analysis?
EMA is a robust technical analysis tool prized for its significant influence on trading choices. Here are some of the reasons.
- EMA offers fast buy and sell signals, which is very important for intraday traders requiring swift decision-making.
- EMA indicates the trend. Its sensitivity to recent price changes helps traders detect real-time market trends and, therefore, make timely adjustments in trading positions.
- Traders can create more complex trading strategies by incorporating EMA along with other indicators, leading to enhanced forecast precision and decreased risks.
- By using recent price action, EMA helps traders in different markets to place effective stop-loss orders, thus improving risk management.
Formula for Exponential Moving Average (EMA)
EMA (today) =(Today’s price ×Multiplier) + (Yesterday’s EMA ×(1−Multiplier))
The EMA is calculated using the following formula:
EMA (today) =(Today’s price ×Multiplier) + (Yesterday’s EMA ×(1−Multiplier))
The Multiplier, in turn, is defined as:
Multiplier = 2/ (Number of Period + 1)
Let’s have a closer look at all the elements of the formula.
-
Today’s price. This is the closing price at the end of the trading day.
- Multiplier: This part adjusts the importance assigned to the recent price. The multiplier formula 2/(Number of Periods + 1) enhances the emphasis on recent prices as the number of periods decreases, resulting in the EMA becoming more responsive to recent price changes. This is why traders who must respond rapidly to price fluctuations prefer EMA.
- Yesterday’s EMA. This is the EMA from the previous period or day. It carries forward the previous EMA value, which is then adjusted by the new price data.
The main idea of the EMA formula lies in its emphasis on recent data points, which is why it is referred to as "exponential." The weighting used in EMA makes it more responsive to price changes than SMA, as the Simple Moving Average gives the same weight to all values in the period.
How To Calculate EMA?
Here’s a step-by-step breakdown of EMA calculation.
Step 1: Determine the SMA (Simple Moving Average). Begin by computing the Simple Moving Average (SMA) for the first period. This represents the initial EMA value. For instance, when determining a 50-day EMA, you should find the average closing prices for the initial 50 days.
Step 2: Determine the multiplier using the formula mentioned above. This multiplier will emphasize the weight of more recent data in the calculation.
Step 3: Apply the EMA Formula described above. This equation will adjust the EMA each day by adding in the most recent price and maintaining the impact of previous values from the prior EMA calculation.
What Is An Example Of A 200-Day Exponential Moving Average (EMA) Calculation?
The first step is to calculate the Initial EMA for these prices. This is done by adding all 200 closing prices and dividing by 200. Let’s say that the total of the first 200 days' closing prices equals 20,000. Then the initial EMA will be:
Initial EMA = 20000/200=100.
Then, let’s calculate the multiplier for this period.
The multiplier = 2/(200+1)≈ 0.00995
Once the initial EMA and multiplier are set, you can compute the EMA for the following days using the latest closing price. Let’s say that the closing price for day 201 is $55 and the closing price for day 200 is $50. The calculation will be as follows:
EMA (day 201) = (55×0.00995)+(50×(1−0.00995)) = 50.04975
What Is An Example Of A 50-Day Exponential Moving Average (EMA) Calculation?
The calculation of the 50-day EMA is done similarly.
Let’s say the sum of the first 50 days' closing prices is 1500. Thus, the initial EMA will be:
Initial EMA =2500/50=50
For a 50-day EMA, the multiplier is calculated as follows:
Multiplier = 2/50+1= 0.03922
Now, knowing the initial EMA and the multiplier, we can calculate the EMA for day 51. Let’s imply that the closing price of the asset on day 51 is $52.
EMA day 51=(52×0.03922)+(50×(1−0.03922)) = 50.07844
Applications of the Exponential Moving Average
The Exponential Moving Average (EMA) is a versatile tool in technical analysis. It helps traders improve their understanding and visualization of price trends and market behaviors.
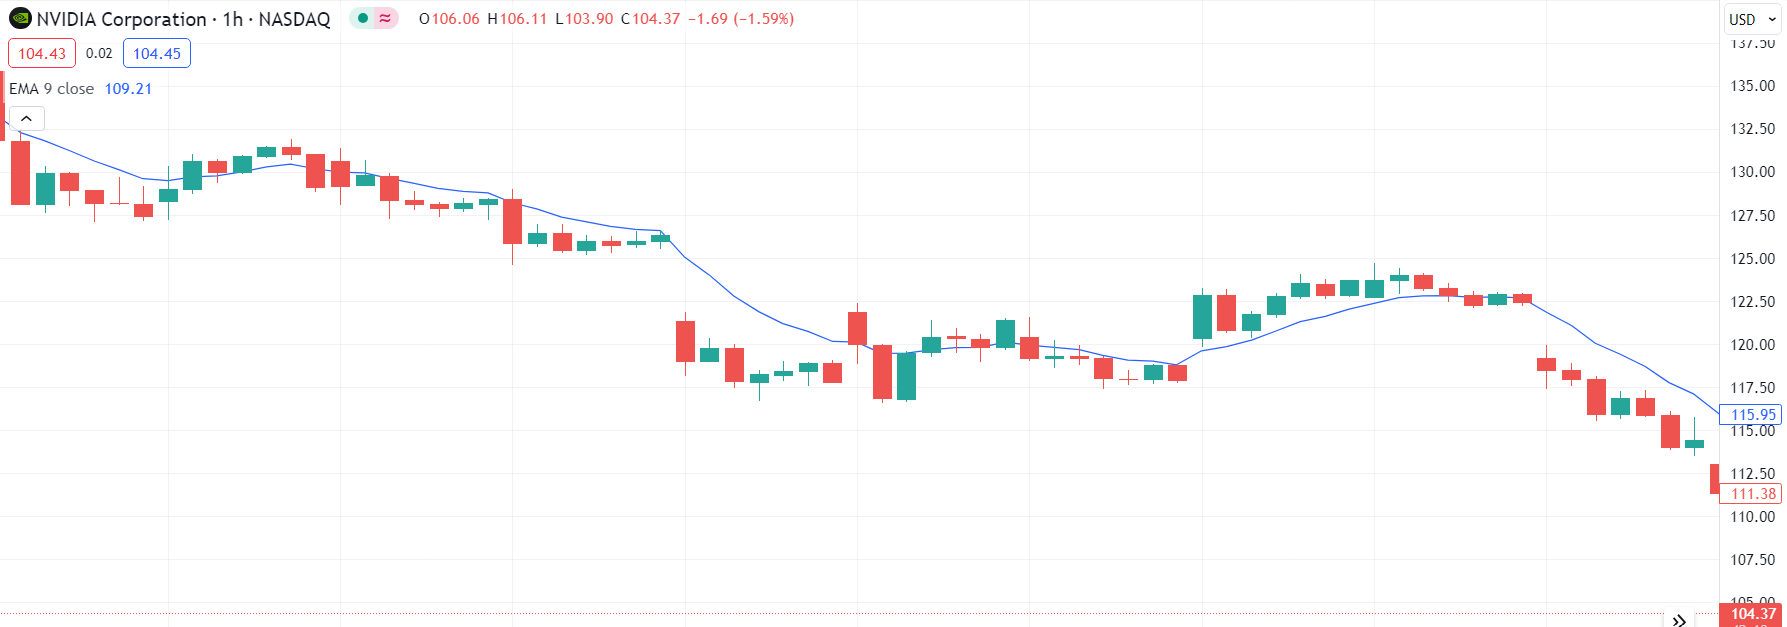
1. Highlighting Trends
EMA is highly effective in indicating the direction of price trends. It shows an upward trend as the average rises and a downward trend as the asset price falls. This indicator allows traders to readily identify changes in market momentum and adapt their strategies accordingly.
2. Support and Resistance Bands
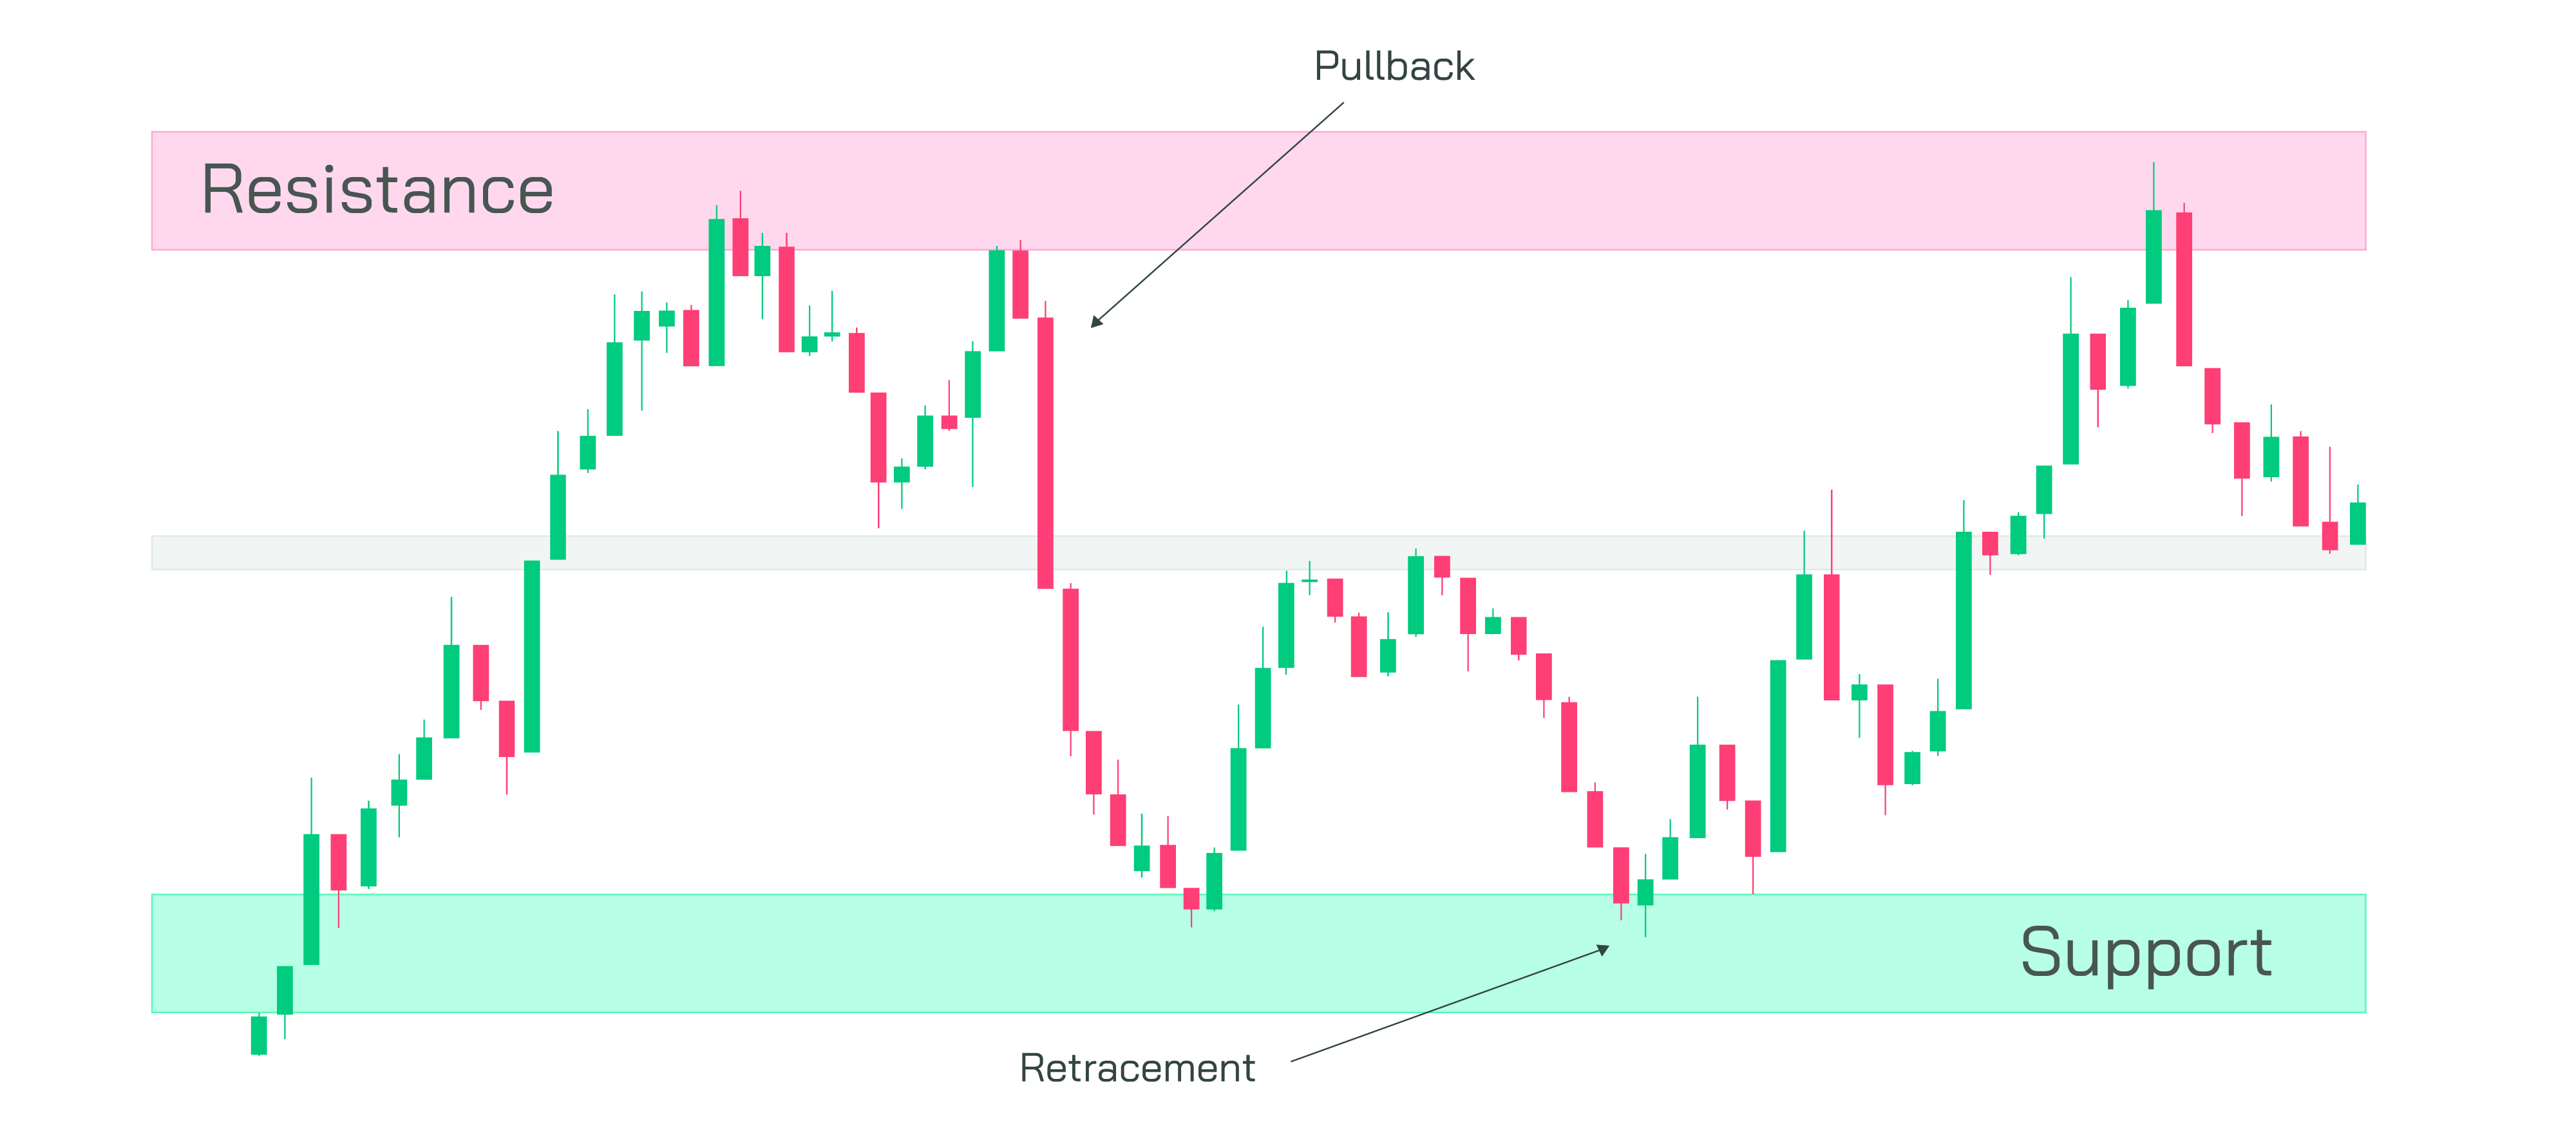
EMA also functions as flexible support and resistance levels, adjusting to market changes better than fixed support and resistance lines. As the price of an asset approaches its EMA and decreases, the EMA can serve as a level of support, potentially causing the price to rebound. On the other hand, in a bullish market, the EMA may serve as a barrier that the price finds difficult to overcome.
What Are The Advantages Of EMA?
The Exponential Moving Average (EMA) comes with a specific set of benefits that help traders navigate the complexities of financial markets. Here are some of them:
-
Responsiveness to price changes. EMA decreases the lag by giving more importance to the latest price data. This feature allows traders to spot trend reversals faster compared to other moving averages due to its high sensitivity to price fluctuations.
- Versatility across timeframes. EMA is suitable for different timeframes, ranging from very short (minutes) to longer ones (days or weeks). This indicator is applicable for both day traders and long-term investors.
- Trend confirmation. An increasing EMA shows an upward trend, hinting at a possible opportunity to buy assets, while a decreasing EMA indicates a downward trend, potentially signaling a moment to sell.
- Smoothed data. EMA offers a less cluttered view of price movements as it emphasizes recent price action over older data, in contrast to SMAs which consider all data equally. This helps traders avoid confusion caused by sudden price fluctuations.
What Are The Disadvantages Of EMA?
While the Exponential Moving Average (EMA) is a valuable tool in technical analysis, it is not without its drawbacks.
-
Lagging indicator. Even though the EMA is more reactive than other averages, it is still a lagging indicator. It depends on historical prices, so it can only validate trends once they have started, possibly causing missed chances in fast-changing markets.
- Possibility of mixed signals. EMAs may produce conflicting signals when combined with other technical indicators. This can lead to confusion and uncertainty, especially for novice traders.
- Vulnerability to price gaps. EMA may experience a more significant impact from price gaps, particularly in times of high market volatility. These spaces have the potential to alter the EMA, resulting in inaccurate indications of the current market direction.
Bottom Line
The EMA is a technical analysis indicator that gives more weight to recent prices compared to older data points and provides traders with a current view of market trends. The EMA helps market participants see the dynamics more clearly and quickly by minimizing lag and smoothing out price movements.
Using the EMA can be very helpful. It is a robust and easy-to-use tool you can implement to indicate possible changes in trends and reversals. Nevertheless, for best outcomes, it is recommended to combine the EMA with other technical analysis tools to validate signals and improve the accuracy of decision-making.
FAQs
Is The EMA Better Than The SMA for Day Trading?
Many traders often opt for the Exponential Moving Average (EMA) for day trading due to its quicker response to recent price fluctuations compared to the Simple Moving Average (SMA). The EMA's ability to adapt to new information makes it better for tracking rapid price changes and trends.
What Is a Good Exponential Moving Average?
The quality of an EMA is determined by both your trading strategy and the specific time frame. Short-term traders usually use 12-day and 26-day EMAs to monitor average convergence divergence, whereas longer time frames may opt for 50-day or 200-day EMAs.
What Time Frames Are Commonly Used For EMAs?
EMAs are highly versatile and can be used in different time periods. Typical time frames for EMAs are 10, 20, 50, 100, and 200 days. The choice of shorter or longer EMAs depends on the trader’s preferences and the price action they want to assess.
Is EMA The Same as EWMA?
While EMA and Exponentially Weighted Moving Average (EWMA) give more weight to recent data points, they differ slightly in calculation and context. EWMA is more commonly used in statistical analysis and risk assessment, not just trading.
How Do You Read Exponential Moving Averages?
Look for the direction of the EMA line. The rising EMA suggests a bullish trend, while a falling EMA indicates bearish market conditions. Crossovers of different EMAs can signal potential buy or sell opportunities, reflecting changes in price momentum.