Flag Pattern
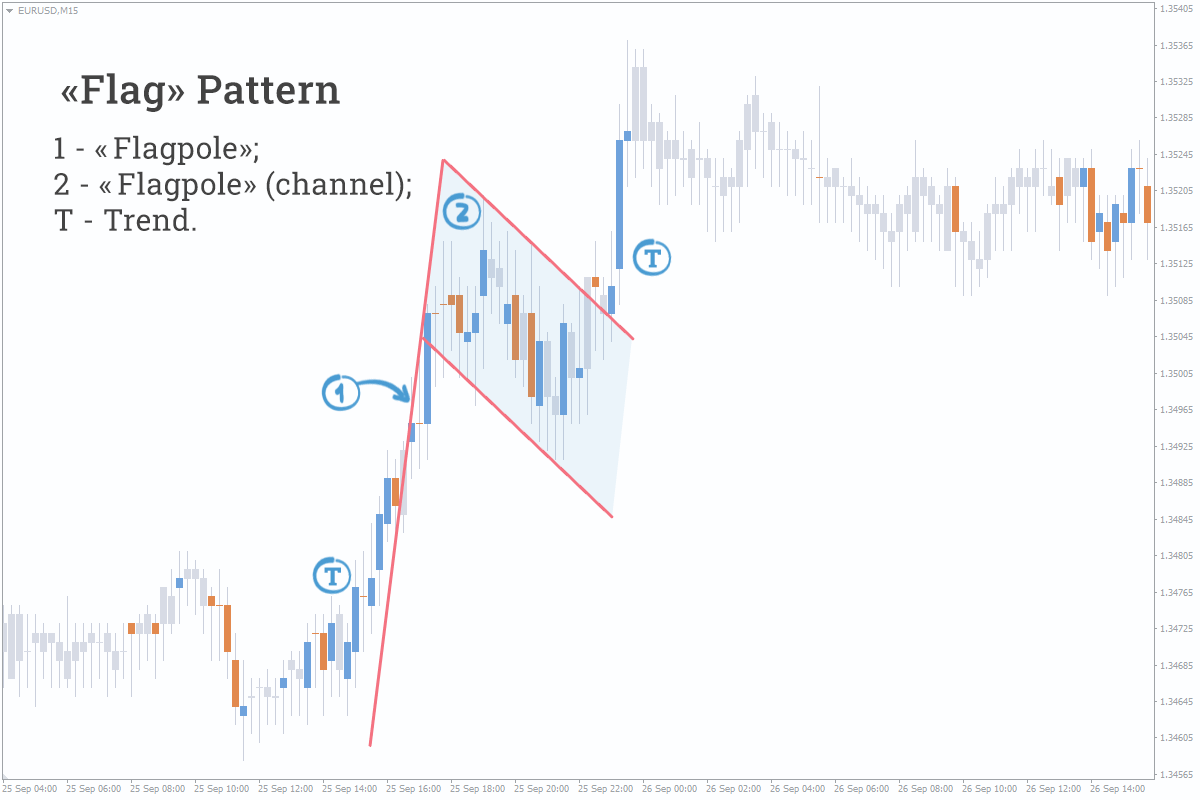
Table of contents:
What Is a Flag?
How a Flag Pattern Works
Different Types Of Flags You Should Keep An Eye Out For
What Happens After a Flag Pattern?
How does Flag Pattern Differ from Other Chart Patterns?
Flag Pattern Examples
How to Trade a Flag Pattern?
The Bottom Line
FAQs
In trading there are many chart patterns, candlestick models, there is fundamental and technical analysis, trading strategies - and all this is designed to predict the price direction as accurately as possible in a seemingly unpredictable market and achieve the profit target. But in this article we will talk about one of the most common chart patterns - the flag pattern. There are different variations of this pattern, in order to successfully use it in trading you need to know not only what it looks like, but also what price action you can expect during these flag patterns and after them. We will discuss all these aspects in this article.
What Is a Flag?
A flag is a trend continuation pattern that allows a trader to enter the market in the middle of a trend. A flag pattern doesn’t look like other patterns, it doesn’t have head and shoulders, instead of them, flag pattern consists of a strong movement and consolidation.
It is formed when the price of an asset moves within a strong upward or downward trend, which suddenly stops.
After this, the price action is almost flat, often against the trend. Now two trend lines have formed on the chart - at the top and bottom of the range - forming a rectangle. Thus, the whole figure looks like a flag.
Eventually the price breaks the flag and continues to move in the direction of the original trend, giving the trader the opportunity to enter the market at a slightly better price than before the flag was formed. There’re a lot of trading strategies based on flag patterns.
Like most other patterns, flag patterns come in bullish and bearish shapes.
Key takeaways:
-
A flag pattern, in technical analysis, is a price chart characterized by a sharp countertrend (the flag) succeeding a short-lived trend (the flag pole).
- Flag patterns are accompanied by representative volume indicators as well as price action.
- Flag patterns signify trend reversals or breakouts after a consolidation period.
- There is a bull flag pattern and bearish flag pattern.
How a Flag Pattern Works
Typically, the flag patterns show consolidation during an active trend, either up or down. Consolidation period occurs in the opposite direction of the trend. Flag patterns look like this: there is an active wave of the trend, it reaches a peak and a flagpole is formed, then there is a period of consolidation in the opposite direction, consolidation occurs in wave movements, and it does not sharply, but rather smoothly forms a rollback. It is important to clarify that this rollback (it will be the flag) should not cross the middle of the new trend wave. Then the price turns and another strong wave follows in the direction of the trend.
The flag pattern has several main characteristics:
-
The preceding trend
- The consolidation period channel
- The volume pattern
- A breakout
- A confirmation where price moves in the same direction as the breakout
Flag patterns are signaling whether a trend is likely to continue. There are two types: bullish flag pattern and bear flag pattern.
Bullish flag pattern:
What it looks like: A bullish flag pattern happens after a price has been going up (an upward trend, also called a flag pole). Then, the price takes a short pause, consolidating in a narrow range, forming a flag shape.
The volume story: During the initial upward trend, there's a lot of buying activity (high volume). But during the consolidation period, the volume drops, meaning fewer people are buying or selling.
The breakout: When the price breaks out of the flag, it's a signal that the upward trend is likely to continue. The drop in volume during the consolidation suggests that a burst of fresh buying activity is about to push the price higher, and your profit target will be achieved.
Bear Flag pattern:
What it looks like: A bear flag pattern happens after a price has been going down (a downward trend, also called flag pole). Then, the price takes a short pause, consolidating in a narrow range, forming a flag shape.
The volume story: During the initial downward trend, there's a lot of selling activity (high volume). During the consolidation phase, the volume stays high, indicating that the selling pressure is still strong.
The breakout: When the price breaks out of the flag, it's a signal that the downward trend is likely to continue. The sustained high volume during the consolidation suggests that the selling pressure is likely to intensify and your profit target is likely to be achieved.
Both bull flag pattern and bearish flags are characterized by parallel lines forming the "flag" during the consolidation period. Sometimes, these lines converge, creating a wedge or pennant pattern, which can also indicate a continuation of the existing trend.
Flag patterns are considered reliable signals of continuation because they suggest that a trend is poised to resume its direction. The pause in price action, combined with the specific volume patterns, hint at a gathering of energy for a strong breakout move.
Different Types Of Flags You Should Keep An Eye Out For
We have already mentioned that there are several types of flag patterns, and these are not only bearish and bull flag patterns, but also high and low flags, pennant flags, wedge flags. We'll go into more detail about each of these flag patterns below:
-
High and low flags are the case when the price rises or falls sharply, then a correction occurs and the trend continues.
- Bullish flag pattern is a bullish continuation pattern formed when the price of a stock rises rapidly, then makes a short consolidation, and grows further.
- Bear flags are a pattern that is formed with a confident downward movement, with short-term consolidation and continuation of the bearish trend.
- Pennant flag is a bullish or bearish pattern similar to a pennant flag. The flag itself has a triangular shape, and the flagpole is inclined.
- Wedge Flags - Can be a bullish or bearish continuation pattern. The consolidation chart stays within the wedge-shaped flag.
 (1))
Regardless of what type of flag pattern is on the chart, the most important part of it will be the flag pole, since it is this that characterizes the confident price movement.
What Happens After a Flag Pattern?
Flag patterns are a special tool that traders use to guess which way the price of a stock or other asset might go next. These patterns are easy to spot because they look like a flagpole with a little flag on top.
The main thing about flag patterns is that they usually show that the price action will keep going in the same direction it was going before the flag showed up. That's why traders call it a continuation pattern. The flag part is like a short break in the trend.
When traders see a flag pattern, they wait for the price to break out of the flag before making any trades. Once the price moves above or below the flag's borders, the pattern is complete, and the price action is likely to keep going in the same direction as before and at that moment you can set a profit target.
If it's a bear flag, it means the price will probably keep going down. A bull flag happens when the price has been going up, and it's a sign that the price will likely keep rising after the pattern finishes.
Traders use flag patterns as a signal to enter a trade in the same direction as the breakout. They put stop losses below the bottom or above the top of the flag to protect themselves in case the trade doesn't work out.
Another clue that the breakout is real is when there's a lot of trading volume. Traders also use other tools like technical indicators, fundamental analysis or pattern head and shoulders to double-check that the flag pattern is telling the truth before they make a trade.
By learning to recognize flag patterns, traders can get better at predicting when a trend will keep going and make smarter trading choices. It's a cool pattern that can help traders understand price movements and trade with more confidence.
How does Flag Pattern Differ from Other Chart Patterns?
The flag pattern is primarily a movement continuation pattern. Most other chart patterns such as double bottoms, double bottoms or head and shoulders indicate a reversal, but the flag pattern indicates a continuation of an already existing trend. The flag pattern is generally shorter in duration than other patterns and less complex in its structure.
The flag pattern is easier to trade as it can provide clear entry points, stop losses and take profits. Consolidation indicates profit taking after a possible movement. The flag pattern gives a clearer picture of what is happening on the market and more reliable signals.
Flag Pattern Examples
In this example we can see a bull flag pattern. The price is growing steadily, then a period of consolidation occurs, and then buyers confidently pull the price up. It is worth noting that a strong trend is not always accompanied by a large trading volume, however, many traders prefer to trade those trends where this volume is present, this gives reliability and increases the likelihood of a successful transaction.
 (2))
The picture below shows a bear flag. The same logic as in the previous example. First, a steady drop in price, period of consolidation and continuation of the trend.
 (1))
How to Trade a Flag Pattern?
Trading flag patterns is not as difficult as it seems, after you have found the flagpole on the chart and determined the formation of the canvas, draw 2 parallel lines along the tops of the canvas - support and resistance.
At this stage, you can already plan a goal for working out the figure.
-
Select the ruler tool or price range on the chart and measure the height of the flagpole from its base point to the support line and resistance line of the canvas. 2 goals - before the resistance line this is the maximum potential of the figure, before the support line there is a smaller goal, but more realistic.
- At the point of resistance breakdown, plot the previously obtained data on the chart, these will be the targets of the figure.
- During a breakdown, it is important to monitor volume indicators! Increased, explosive volumes serve as confirmation of a signal to enter a trade; the lack of volume is an alarming sign, in this case, it would be better to skip this situation.
- If the bullish flag breaks down (not falsely), this is interpreted as a weak signal and trading flag patterns in such situation is not recommended.
 (1))
It is also important to think soberly and logically in the market and not be too greedy, when trading flag patterns. For example, the growth potential of a figure along the height of a flagpole is 250%. But immediately after the breakout, within 1-2 candles, the quote showed an increase of 100-150%, in this case it would be logical to fix the entire position, part of it, or at least protect the unrealized profit with a stop loss order. It often happens that participants wait again and again, but instead the quote turns around and goes to update the minimums, without working out the goals of the figure.
But remember, trading flag patterns doesn’t guarantee 100% results, and in order to build a high efficiency strategy you can use Just2Trade solutions - https://j2t.com/solutions/mt5global/.
The Bottom Line
The flag pattern is a fairly simple and useful pattern that allows you to find entry points, take profits and make successful transactions. But remember that you cannot rely on trading flag patterns only; you can use other patterns, head and shoulders for example; other factors of technical analysis are also necessary for a successful trade.
FAQs
Does Trading Flag Pattern Work For Beginners?
Beginners can use a flag pattern, as we mentioned in the article, the flag is not the most complex pattern, but there are other factors to consider.
Is a Flag Pattern Bullish?
The flag pattern can be either bullish or bearish.
Is it Possible to Trade Flag Pattern with Fibonacci Retracement?
Yes, combining flag patterns with Fibonacci retracement can enhance trading strategies. Fibonacci levels offer potential entry and exit points when the price breaks out of a flag pattern.
Is It Worth It To Trade a Flag Pattern?
Of course, it’s worth trying to trade the flag patterns, it can be a great addition to your strategy.