Golden Cross in Trading

Table of Contents
Key Takeaways
What is a Golden Cross?
How Does a Golden Cross Form?
Example of a Golden Cross
The Difference Between a Golden Cross and a Death Cross
What Can a Golden Cross Identify?
Mistakes To Avoid While Trading With The Golden Cross
Top Golden Cross Trading Strategies
Bottom Line
FAQs
The golden cross is a well-known trading chart pattern. It is used to indicate possible uptrends in the market. Golden cross usually appears when a short-term moving average intersects with a long-term moving average. Traders use the golden cross to pinpoint powerful buy signals, intending to take advantage of expected upward momentum.
In this article, we will explore the formation of the golden cross, discuss its use cases on examples, and outline some of the successful trading strategies to use with this pattern. Read on to enhance your trading skills and, as a result, maximize potential returns.
Key Takeaways
-
The golden cross is a technical analysis chart pattern that indicates the possibility of a continued bullish market.
- This pattern is formed when the short-term MA crosses the long-term MA from above.
- Traders use the golden cross to discover entry points for buying positions, generate stop-loss orders, and verify signals from other indicators.
- The death cross is the inverse of the golden cross formation, indicating the possibility of a persistent bearish market.
- The golden cross works better when paired with other technical tools like volume, RSI, and EMA.
What is a Golden Cross?
 >
>
A golden cross is a technical pattern that signals a possible upward trend in the financial markets. It typically happens when a shorter-term moving average crosses over a longer-term moving average. Traders most commonly set short-term average at 50 days and a long-term average at 200 days. On the chart, this pattern indicates a transition from selling to buying momentum and signals that the market or asset is moving into a phase of continuous upward trend.
The golden cross signal is regarded by traders and investors as a reliable buy indicator. Essentially, it confirms a market's bullish stage, reassuring traders of the possibility of continued profits. Many experts believe that the golden cross is an unavoidable instrument in trading techniques, while others question its capacity to accurately predict market changes.
How Does a Golden Cross Form?
A golden cross is a strong momentum indicator. It forms in three clear stages. Every phase represents a shift from a pessimistic to an optimistic market attitude.
-
Step 1: Downturn in the Market. At first, the market sees a decrease in both short-term and long-term moving averages. At this stage, investors feel pessimistic and prices usually stay low.
- Step 2: Breakout. During the second phase, a sudden bullish breakout happens. The short-term moving average surpasses the long-term moving average forming the golden cross itself.
- Phase 3: Confirmation. The bullish trend is confirmed when the price continues to rise, and the short-term moving average stays above the long-term moving average. Traders consider this an indication to buy with confidence, expecting more growth in prices.
Important
The support is the level that the asset price usually doesn’t fall below for a period of time
The resistance level, on the contrary, is the level that the price doesn’t usually rise over for a period of time.
Example of a Golden Cross
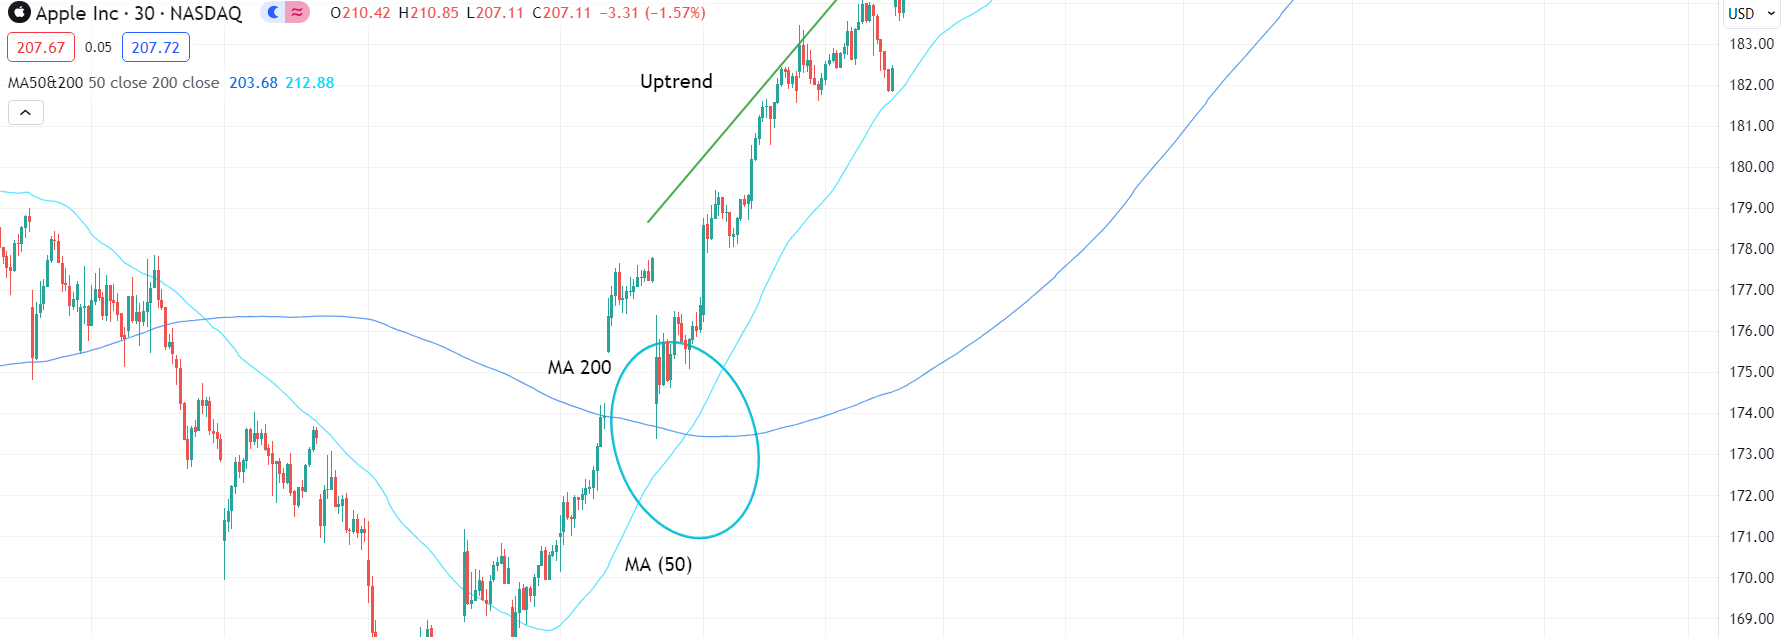
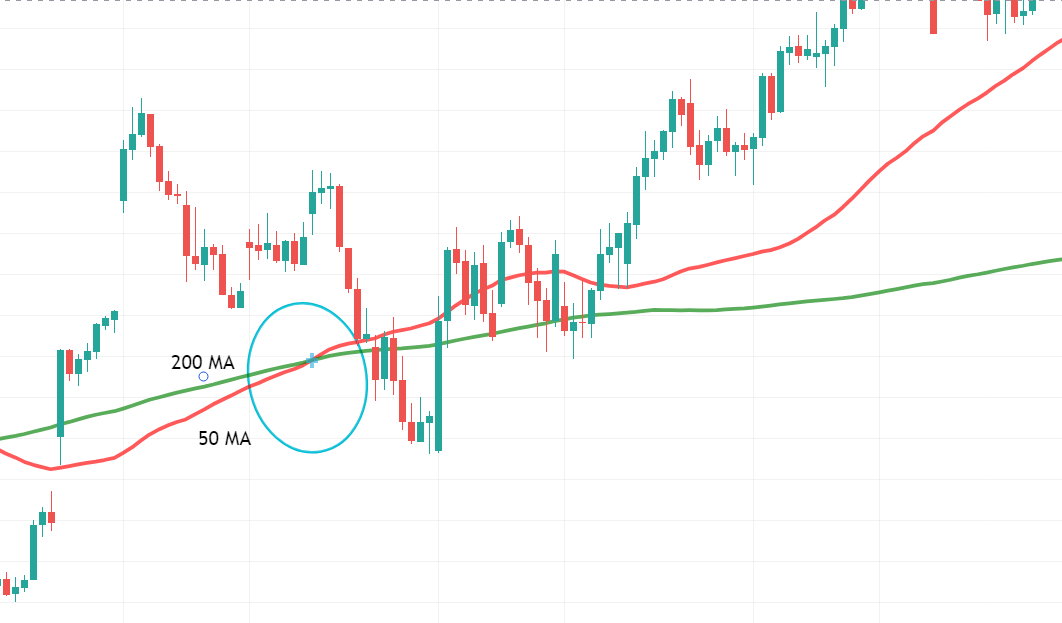
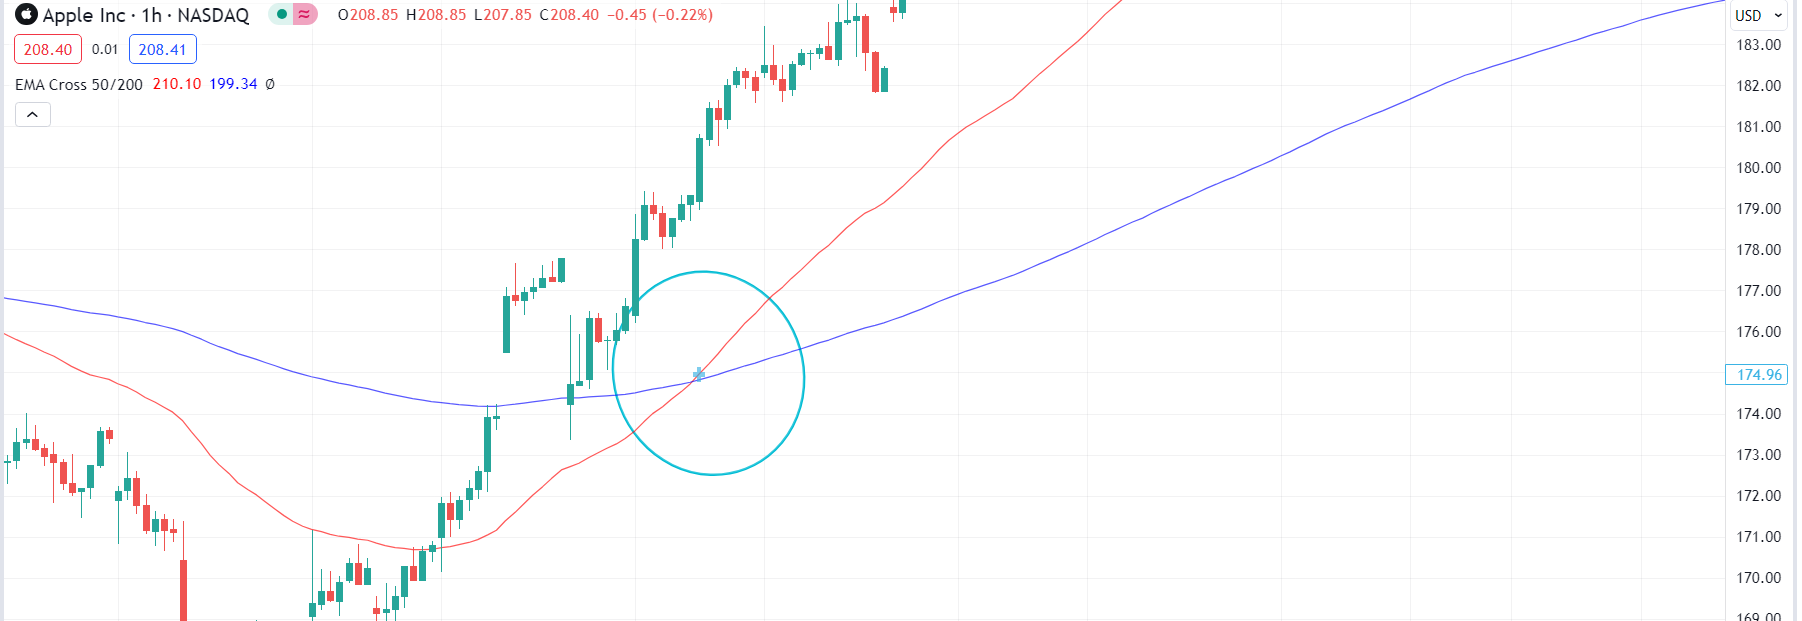
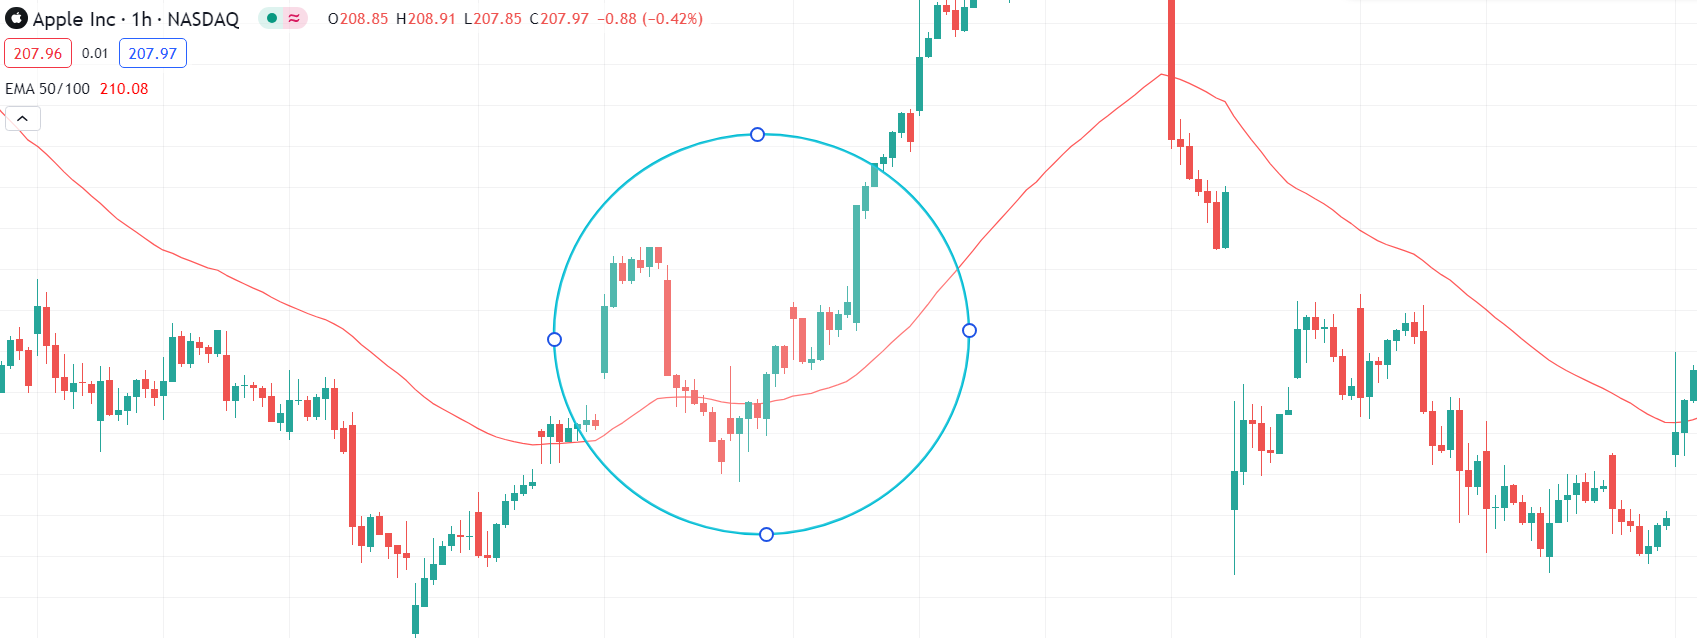
Here is an example of the golden cross with the Apple Inc. stock. On the candlestick chart, you can see two lines of moving averages. The dark blue line stands for the 200-day moving average indicator and the turquoise line represents the 50-day moving average. The golden cross pattern is where these two lines intersect, marked by the ellipse. After the golden cross, the Apple stock enters a significant upward movement, with the price rising from around $174.5 at the point of the cross to more than $183.
The Difference Between a Golden Cross and a Death Cross
The golden cross and the death cross are two opposite chart patterns. Their key difference lies in the formation and the signal they produce.
As we’ve already found out, the golden cross occurs when the short-term MA goes over the long-term MA, forming a cross. This chart pattern is often seen as a bullish signal. It usually identifies the shift from a bear to a bull market, often followed by high trading volume.
Conversely, a death cross is when the short-term moving average crosses below the long-term moving average, signaling a bearish trend. This technical indicator points to a potential downtrend in the market.
Both patterns are important in trading strategies. For beginners, they highlight key market trends, while experienced traders look for confirmation through additional indicators and market context.
What Can a Golden Cross Identify?
The golden cross is a crucial chart pattern for traders at all levels. In the following sections, we will dive deeper into the signals it may produce.
Long Signals
When the golden cross appears, it indicates that the market sentiment is starting to move towards a positive trend. Many traders, consider it a good opportunity to enter a long position, anticipating an increase in the asset's price. Moreover, seasoned traders might use this signal to validate their analysis or to improve their positions, depending on the historical trustworthiness of the golden cross as a sign of continued upward movement.
Stop Losses
Besides spotting possible entry points, a golden cross can also guide traders on stop-loss tactics. These are helpful instruments that allow investors to buy or sell an asset at a set price to prevent large losses. When a golden cross occurs, traders can use it to protect against significant losses by placing stop-losses just below the long-term moving average after recognizing the bullish signal. This strategy provides room for the asset to keep rising without being sold too soon.
Confirmations
The power of all indicators and patterns is increased when they are used in combination. The golden cross can be used to validate other technical analysis tools. For example, aligned with the Relative Strength Index (RSI) it provides additional support for a potential uptrend in the market. Similarly, it can be used together with the Moving Average Convergence Divergence (MACD).
Using other technical indicators in combination with the golden cross can help traders make sure of signals they spot on the charts and adjust their trading strategies to limit the losses and improve their results.
Mistakes To Avoid While Trading With The Golden Cross
Engaging in trading using the golden cross technique can bring significant benefits, however, it also carries some risks. To guarantee successful results, it is important to steer clear of these typical errors.
-
Absence of thorough analysis. Dependence only on the Golden Cross signal without taking into account other technical indicators and fundamental analysis can result in inadequate decision-making. Always make sure to include a thorough examination of the market conditions.
- Inadequate entry points. Opening a position immediately after the golden cross may not be the best timing. Wait for confirmation from other indicators such as volume or RSI to confirm the signal. On the contrary, some experts say that too late entries may lead to missed opportunities and increased risks. Thus, it’s crucial to keep the balance.
- Ignoring the overall market environment. In a bearish or volatile market, a golden cross signal may not be reliable. Evaluate the overall market trends and economic situations before making any trading choices based on this pattern.
- Ignoring the historical performance. It’s recommended to examine previous patterns to determine the level of trustworthiness of the signal for that specific asset.
- Setting inadequate stop losses. Failing to set proper stop-loss orders can result in traders experiencing significant losses when the trend changes direction. It is important to consistently establish stop-losses at a specific price level in order to efficiently control risks.
- Ignoring trading volume. The golden cross is usually accompanied by an increased volume representing favorable market sentiment and potential price rise. As such, volume can be considered an extra tool to confirm golden cross signals. Conversely, not using the volume can lead to wrong decisions and increased trading losses.
Top Golden Cross Trading Strategies
Trading with golden cross can significantly improve your trading results if applied correctly. Let’s have a closer look at common strategies to implement.
Mean Reversion
The mean reversion trading strategy implies searching for a golden cross following a long period of decline. The concept is to take advantage of the reversal by anticipating that the asset will return to its average price. This approach is most effective in markets that typically return to historical averages following major deviations, guaranteeing the reliability of the bullish signal.
50 EMA Carry
The 50 EMA Carry strategy uses the 50-day Exponential Moving Average as a reference point. When a Golden Cross occurs, traders can take long positions and ride the prevailing uptrend. The 50 EMA serves as a level of support, aiding in risk management by placing stop-loss orders slightly below this level. This guarantees defense against unforeseen turnarounds while capitalizing on the robust support level offered by the 50 EMA in a bullish market.
Double Bottom
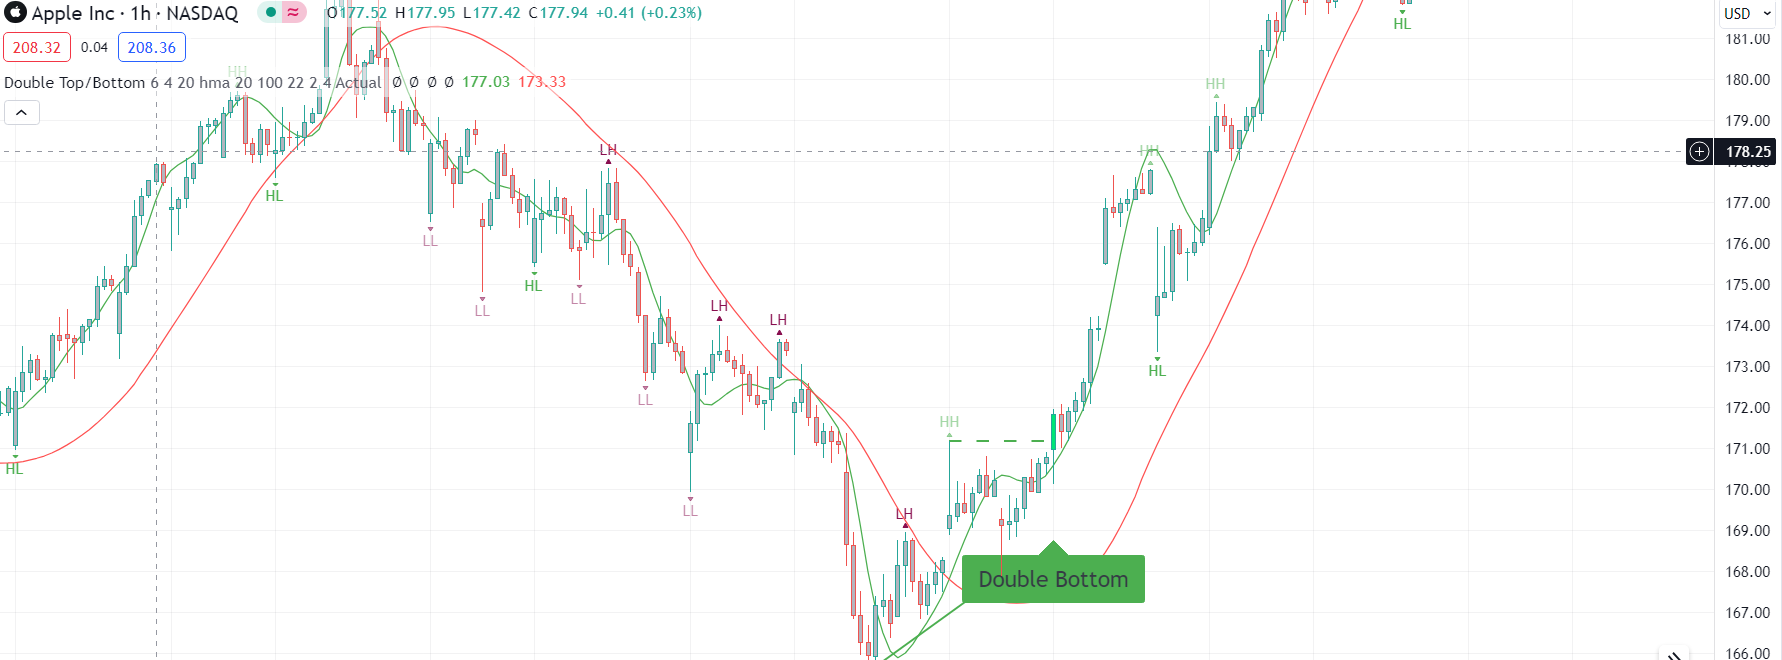
The Double Bottom strategy is a bullish reversal pattern that confirms the Golden Cross signal. A double bottom pattern looks like the letter “W” and is represented by two roughly equal lows and a moderate peak in between.
A double bottom formation followed by a Golden Cross signals a robust support area. Traders have the opportunity to open long positions at the second bottom, with the Golden Cross acting as validation of a bullish signal. This mix indicates a probable rise in prices, making it a dependable method for pinpointing strong entry opportunities in a market on the mend.
Pullbacks on 50 EMA
This trading strategy is centered on price retracements to the 50 EMA following a golden cross pattern. Traders use the 50 EMA as a support area to enter positions during pullbacks. This method enables traders to enter the current uptrend at a specific price, maximizing entry points and reducing risk. It is especially beneficial in unpredictable markets where prices tend to pull back before resuming their upward trend.
Oscillator Confirmation Strategy
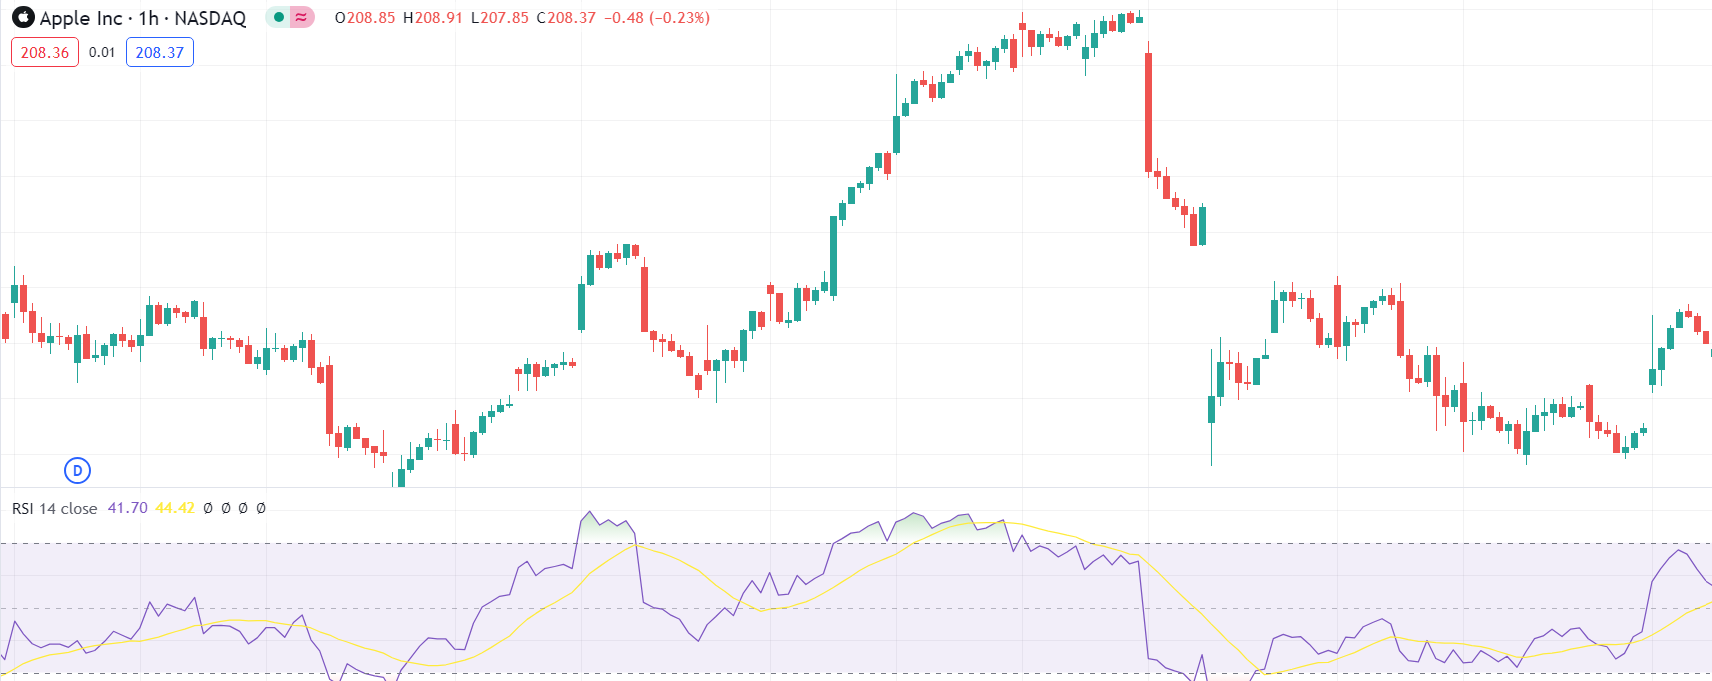
Using oscillators such as RSI or MACD alongside the Golden Cross can improve the precision of signals. Traders add these oscillators to validate the Golden Cross, making sure that the bullish indication coincides with either overbought or oversold circumstances. This thorough examination prevents erroneous cues and enhances trading decisions by considering market conditions and past results. By waiting for both the Golden Cross as well as a confirming oscillator signal, traders can enhance their trust in the potential success of the trade.
Bottom Line
A Golden Cross happens when a shorter-term moving average surpasses a long-term average. This chart formation indicates a possible reversal towards a bullish direction, showing a change in market sentiment from bearish to bullish. It offers traders a solid indication that the upward trend could persist, making it a crucial signal for considering long positions.
For successful trading with the Golden Cross, focus on thorough analysis rather than solely the signal. Take into account the overall market conditions and prevent entering at the wrong time. Examine the asset's past results and establish suitable stop-loss orders below the extended-term average to handle risks. Combining the Golden Cross with other indicators will boost your trading tactics and increase your chances of success.
FAQs
How Do I Identify a Golden Cross on a Chart?
A golden cross is a place where the short-term moving average crosses the long-term moving average from down to up. It indicates a potential shift to a bullish trend and a possible continuation of a bullish market.
Why Are The 50-Day And 200-Day Moving Averages Important In The Golden Cross?
50-day and 200-day terms are most commonly used for short-term and long-term moving averages to identify the golden cross.
Are Golden Crosses Reliable Indicators?
Golden crosses are typically viewed as dependable signals of a positive market outlook. Nevertheless, they are lagging indicators, representing a shift in trend only after it has begun. Traders ought to use extra analysis and other indicators in combination for decision reinforcement.
Can The Golden Cross Be Used In All Types Of Markets?
Golden crosses can be traded on various financial markets, including forex, stocks, commodities, indices, etc. However, they provide potentially more reliable signals in trending markets.
What Should Traders Do Upon Identifying A Golden Cross?
Once having identified a golden cross, consider adding to your long positions or opening new trades that follow the upward trend. Verifying with additional indicators and analysis is crucial to establish a strong trading strategy.