Hammer Candlestick Pattern and Trading Strategies
)
The technical analysis comes with various trading chart patterns that help traders make their strategies more effective. Hammer candlestick formation is one of them. Its name comes from its outlook: a short body at the top and a long weak under. Many traders consider it one of the most essential reversal patterns. So, in this article, we will have a closer look at what a hammer pattern is, how it is formed, and how to trade it.
Table of Contents
Key Takeaways
What Is The Hammer Candlestick Pattern?
How To Identify The Hammer Candlestick Pattern
Variants of the Hammer Candlestick Pattern
Example of How to Use a Hammer Candlestick
The Difference Between a Hammer Candlestick and a Doji
What is the difference between a hammer candlestick and a shooting star?
Limitations of Using Hammer Candlesticks
Psychology of the Hammer
Practical Application
How To Trade The Hammer Candlestick Pattern
Conclusion
FAQs
Key Takeaways
-
A hammer pattern is a bullish formation that signals a potential trend reversal.
- A hammer is formed by a small real body with a long lower shadow also known as a wick.
- Some variations of this pattern include an inverted hammer, a shooting star, and a hanging man.
- Best efficiency is shown when hammers are combined with other patterns and technical tools.
What Is The Hammer Candlestick Pattern
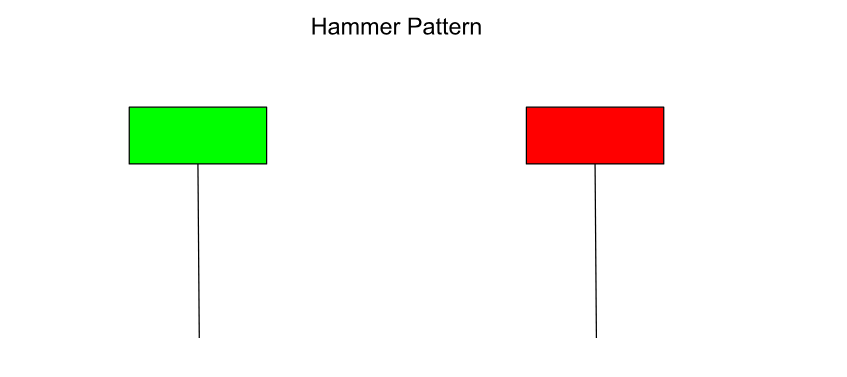
The hammer candlestick is an important pattern in technical analysis. It appears on a price in the form of a “hammer”, marked by a small real body at the top and a long lower shadow. This formation suggests a potential reversal, indicating a transition from a downward trend to an upward trend.
Hammer pattern often occurs after a decline, as it indicates that buyers are stepping in, potentially driving prices higher. The candlestick's long lower shadow indicates that sellers pushed prices down, but buyers regained control, closing the price near the opening level.
An inverted hammer is the opposite formation. It has a small real body at the bottom and a long upper shadow, signaling the potential bullish reversal.
How To Identify The Hammer Candlestick Pattern
Here are the key features to look for when a hammer appears:
- Small real body at the top of the candlestick
- Long lower shadow that is at least twice the length of the body
- Little or no upper shadow
- Hammer occurs after a downtrend in price
Variants of the Hammer Candlestick Pattern
The hammer candlestick pattern can appear in several variations. While the classic hammer has a small body and a long lower shadow, the body color (red or green) can vary, and sometimes a small upper wick can be present. Moreover, there are some other variants you can meet on the financial charts:
- An inverted hammer pattern is identified by a small body and a long upper shadow at the end of a downtrend, suggesting a possible change in price direction.
- The hanging man formation resembles the hammer pattern but forms at the peak of an upward trend, indicating a potential bearish turnaround.
- The shooting star pattern is a bearish version of the inverted hammer, located at the end of an uptrend. It indicates a possible decrease in the market.
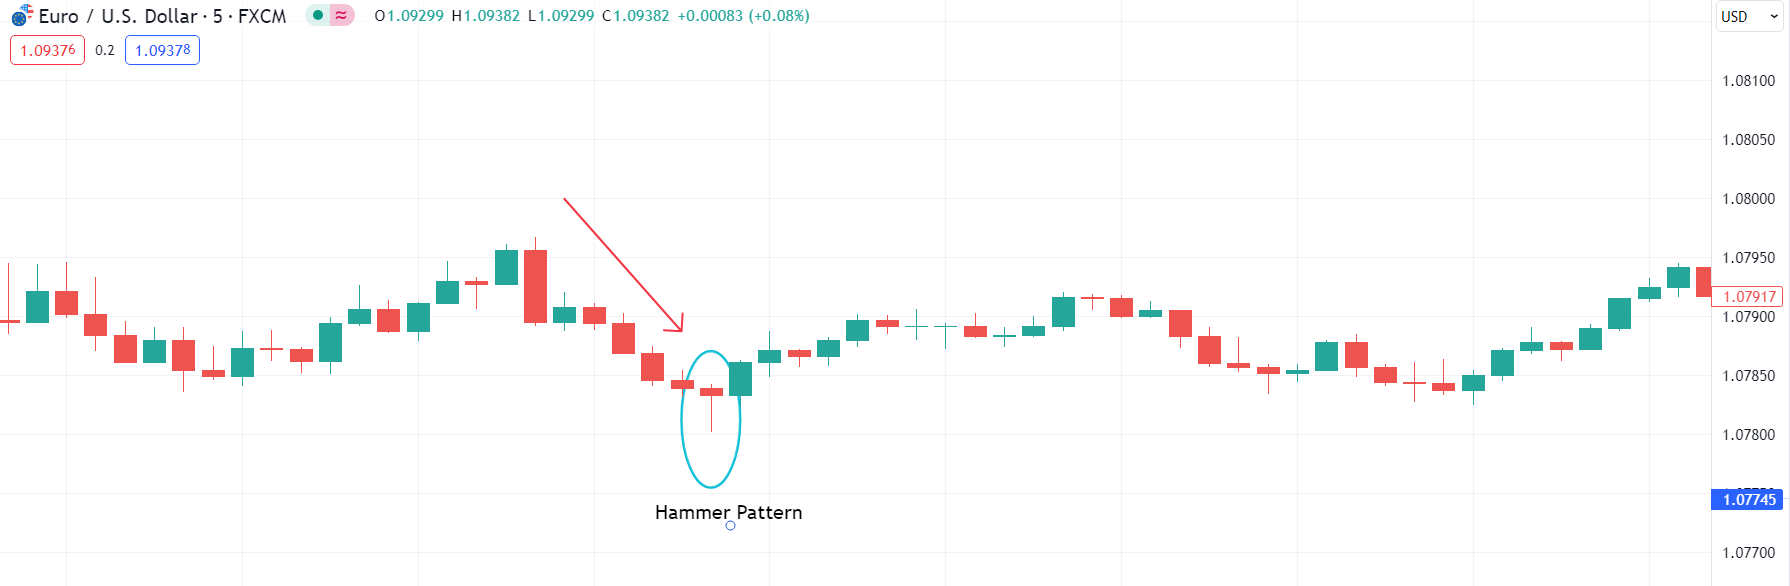
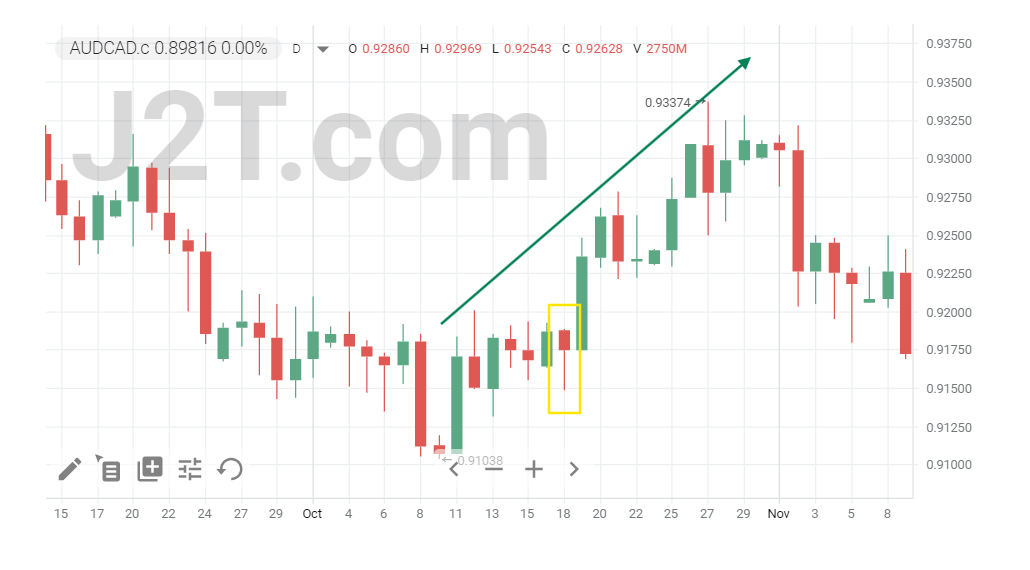
Example of How to Use a Hammer Candlestick
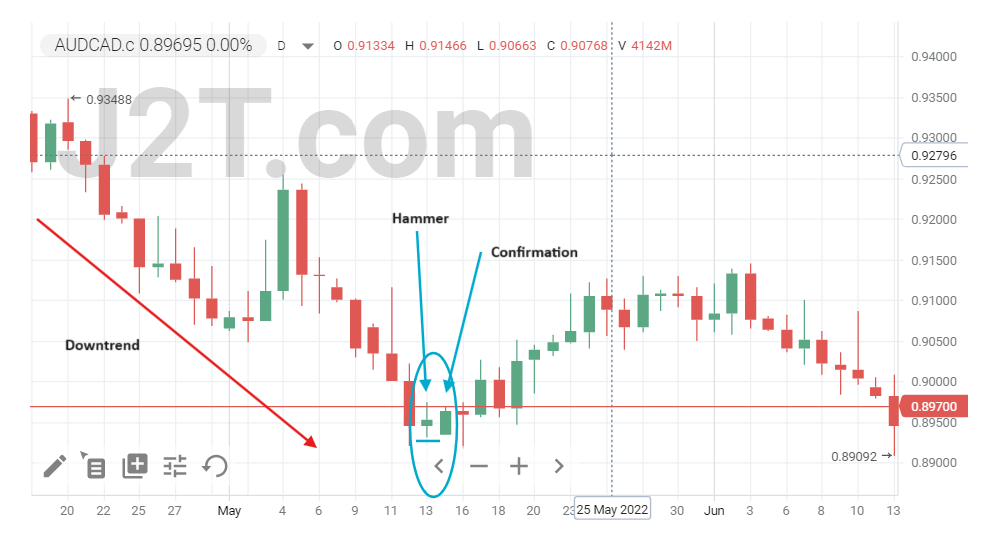
Let’s consider an example of hammer trade formation on the forex chart. A long shadowed hammer forms after a downtrend. A trader spots this pattern and waits for a confirmation candle to confirm the signal. This can be a bullish candle that closes above the hammer's body. The trader then decides to buy the asset, entering a long position. To manage risk, he sets a stop loss just below the hammer's shadow. This strategy ensures that the trader minimizes trading risks while capitalizing on the potential trend reversal.
The Difference Between a Hammer Candlestick and a Doji
A hammer:
- suggests a possible change in price direction;
- its long lower shadow and small body indicate a potential shift from a downward trend to an upward trend.
A doji:
- represents indecision in the market;
- can mean either a change in direction or the continuation of the current trend.
What is the difference between a hammer candlestick and a shooting star?
A hammer:
- has a small body and a long lower wick;
- appears during the downtrend;
- signals the potential bullish reversal;
- indicates that buyers are regaining control.
A shooting star pattern:
- has a short body and a long upper wick;
- occurs after an uptrend;
- indicates a potential bearish reversal;
- signals that sellers are taking control of the market.
Limitations of Using Hammer Candlesticks
While hammer candlesticks are useful tools in technical analysis, you should be aware of their drawbacks.
- False signals. Hammers can sometimes appear without resulting in a trend reversal, which may lead to some losses if you don’t implement robust risk management.
- Need for Confirmation. As with any other technical indicator, relying solely on a hammer candlestick without waiting for a confirmation candle can be risky. Thus, it’s better to combine it with other patterns or tools.
- Limited information and efficiency. The effectiveness of a hammer candlestick can vary depending on the overall market conditions and trend strength, making it less reliable in volatile markets.
Psychology of the Hammer
When trading hammer patterns, you need to know that in a bear market, prices make lower highs and lower lows, indicating pessimistic sentiment. Nonetheless, the presence of a hammer indicates a potential reversal. The longer lower shadow shows that a bearish force caused a drop in prices, but bullish investors intervened and pushed the price back up toward the opening level. This change in price direction indicates that buyers may be growing stronger, possibly turning around the downward trend.
Practical Application
Here are some practical considerations to keep in mind when trading hammer candlestick patterns.
The Hammer Signal
A hammer candlestick suggests a possible shift from a downward trend to a rise in price. The extended hammer bottom shadow indicates that sellers heavily lowered the price, but buying traders managed to regain control and bring the price back close to the opening point. The small real body of the pattern indicates the shift in momentum, prompting traders to get ready for a potential reversal.
Looking for Confirmation
Relying only on the hammer pattern can be risky. Wait for confirmation before taking any action. It usually occurs when the next candlestick closes above the hammer's real body.
Placing Stops and Taking Profits
Trading hammer patterns requires a risk management strategy. Place stop-loss orders right below the lower shadow of the hammer to protect your position against potential losses in case the price goes in the opposite direction. Establish take-profit levels by referencing important resistance levels or past highs.
How To Trade The Hammer Candlestick Pattern
In this section, let’s look at how you can trade hammer candlestick to achieve more prominent results in your trading platform.
Strategy 1: Pullbacks On Naked Charts
When implementing this strategy watch for hammer candlesticks that form during a pullback in an overall uptrend. This strategy relies on pure price action, without any indicators. Once a hammer appears, enter the trade at the next candle's open, with a stop loss below the hammer's low.
Strategy 2: Trading The Hammer With Support Levels
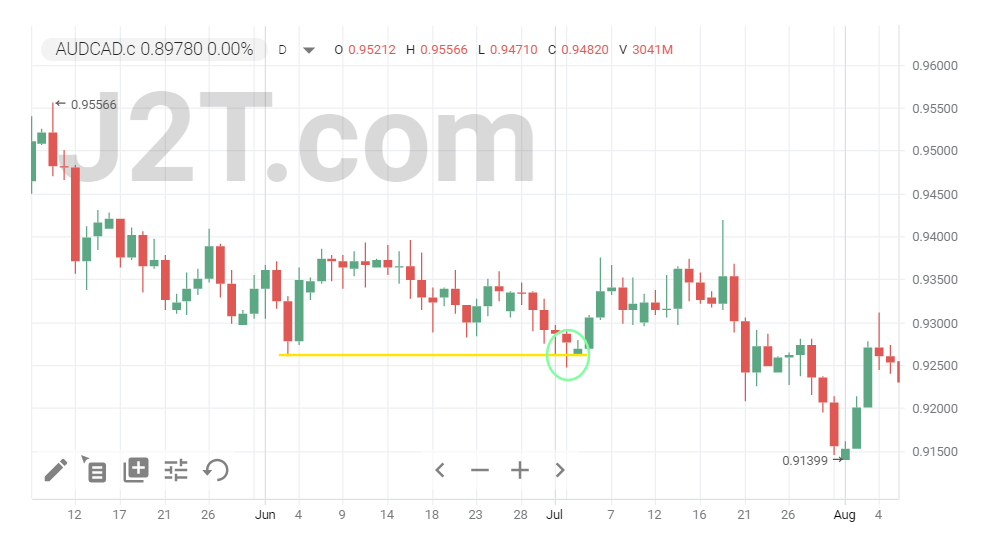
This approach centers on hammers that develop close to important support levels. Begin by drawing support levels on your charts. Wait for the price to fall and hit the support level. When a hammer appears at that significant support zone, it suggests a strong potential for a price reversal. Go long when the price breaks the high of the hammer. Get into the trade only after confirmation, setting a stop loss for risk management.
Strategy 3: Trading The Hammer With Moving Averages
Moving averages will help you determine the general trend direction. If a hammer appears above a key moving average (such as the 50-day or 200-day), it indicates a possible chance to buy. Wait for confirmation before entering the trade, and use the moving average as a flexible support level for placing stop-loss orders.
Strategy 4: Trading The Hammer With RSI Divergences
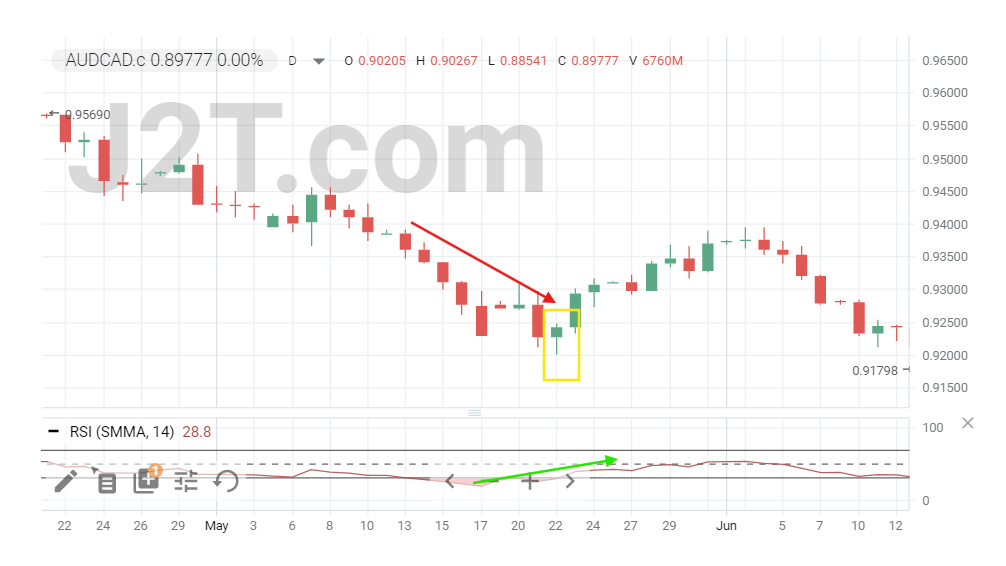
RSI (Relative Strength Index) divergences can enhance the hammer pattern's effectiveness. Look for hammers that coincide with bullish RSI divergences, where the price forms a lower low, but the RSI forms a higher low. This indicates weakening bearish momentum.
Strategy 5: Trading The Hammer With Fibonacci
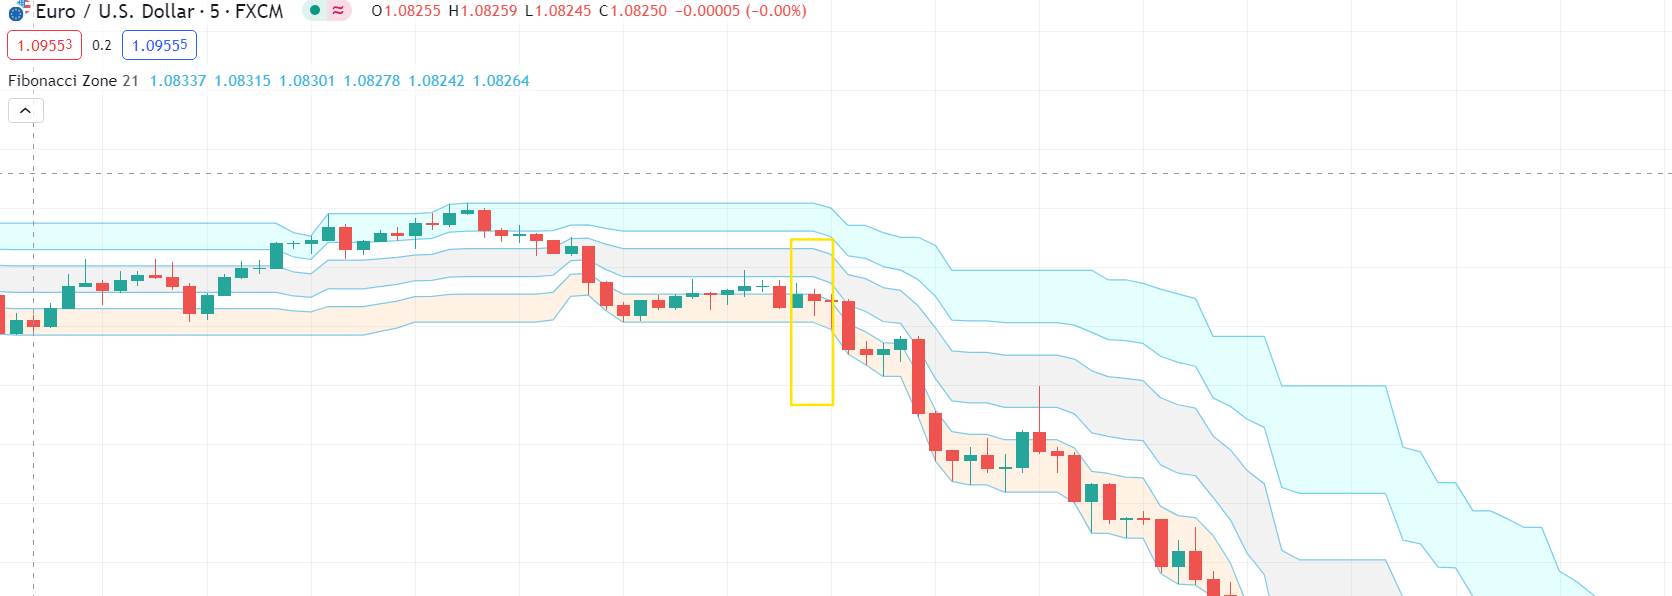
Various Fibonacci levels may be more effective depending on the strength of the trend. Begin by recognizing an upward trend, then be patient for a decrease. Use your Fibonacci instrument to establish levels ranging from the low point to the peak of the movement. If the price reaches a Fibonacci level and forms a hammer candlestick pattern, enter a long position when the price surpasses the high of the hammer. Place your stop loss below the Fibonacci level and aim for a higher level for your take profit, in anticipation of a potential upward movement.
Strategy 6: Trading The Hammer With Pivot Points
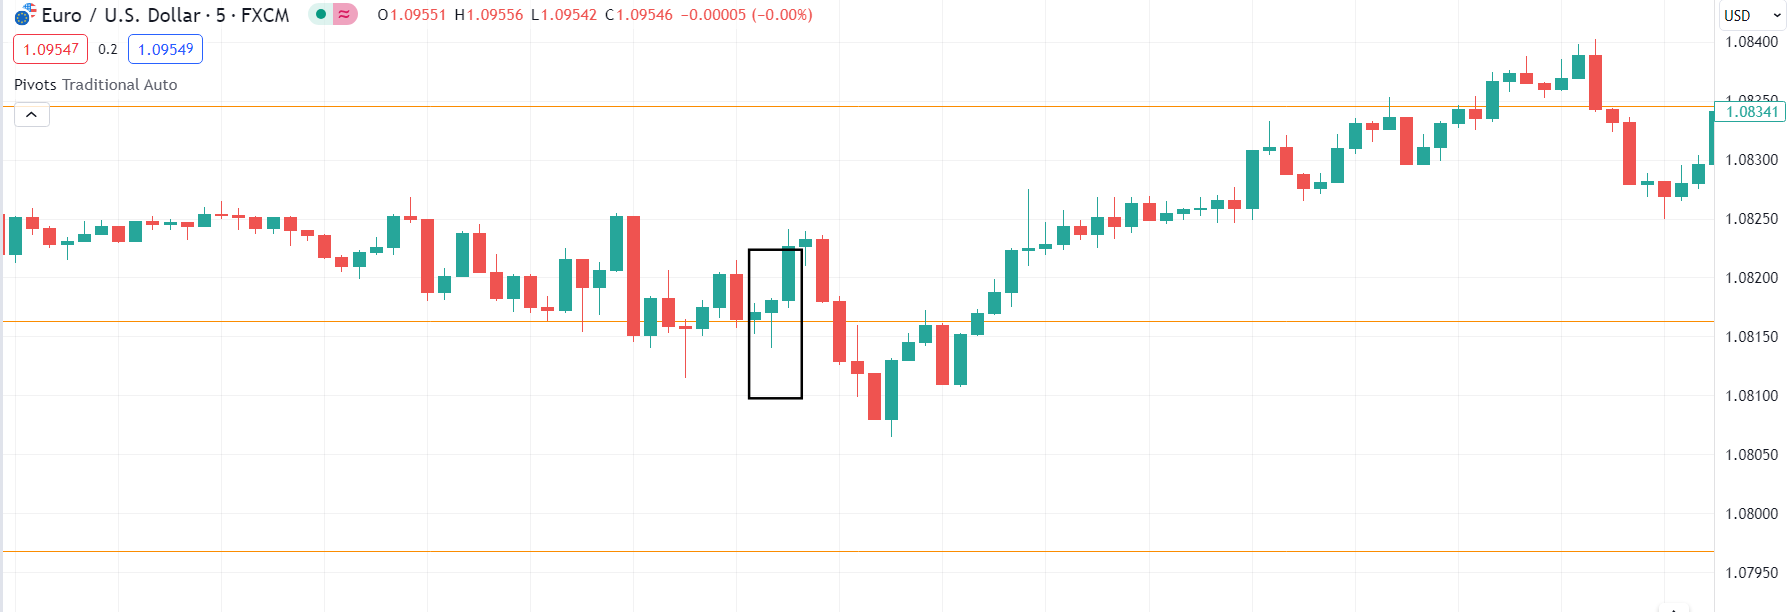
Pivot points are useful for identifying potential support and resistance levels. When a hammer forms near a pivot point, it indicates a possible reversal. Enter the trade upon confirmation, with a stop loss below the pivot point to protect against adverse price movements.
Conclusion
The hammer candlestick pattern is a valuable tool for traders of any level. It indicates possible reversals and provides strategic entry points in different market conditions. By integrating these patterns with proper risk management and confirmation techniques, you can maximize your profit potential and minimize losses.
FAQs
Is a hammer candlestick pattern bullish?
A hammer candlestick pattern is generally considered bullish. It signals a potential reversal in a downtrend, indicating that buyers are starting to gain control.
Is a hammer bullish or bearish?
A hammer is bullish. It appears after a decline in the market and suggests that the market could be reversing upwards.
What is the hammer candlestick rule?
The rule states that the pattern must appear after a downtrend. The lower shadow should be at least twice the length of the real body.
How accurate is the hammer candlestick?
The hammer candlestick is quite reliable, yet it’s recommended to combine them with other technical tools for improved efficiency.
How do you read a hammer candle?
Look for a small body with a long lower shadow during a downtrend. This formation indicates that buyers pushed the price back up after significant selling pressure.