Harmonic Patterns

Table of contents:
Key Takeaways
What are Harmonic Patterns?
Issues with Harmonics
Types of Harmonic Patterns
Why are Harmonic Patterns so Popular in Forex Trading?
How to Identify and Draw Harmonic Patterns
How to Start Trading with Harmonic Patterns
Conclusion
FAQs
Harmonic patterns are a fascinating aspect of technical analysis in forex trading, offering traders a unique way to identify potential market reversals using geometric price formations. By utilizing Fibonacci ratios, these patterns help traders forecast future price movements more precisely. From the popular butterfly harmonic pattern to the intricate bat harmonic pattern, harmonic trading offers a diverse toolkit for spotting market trends.
In this article, we'll explore the advantages of harmonic patterns, discuss the differences between bullish harmonic patterns and bearish ones, and provide insights into how most harmonic traders utilize these patterns. Whether you're a novice or an experienced trader, understanding these popular harmonic patterns can enhance your trading strategy and market analysis.
Key Takeaways
-
Harmonic patterns use Fibonacci ratios to provide accurate and reliable trading signals to help traders make more enhanced market predictions.
- Some common patterns include the bat, the crab, the shark, the ABCD formation, and others.
- While powerful, harmonic patterns require careful identification and risk management to navigate market volatility effectively.
What are Harmonic Patterns?
Harmonic patterns are complex chart formations used in technical analysis to forecast price changes in the stock and forex markets. These shapes are based on Fibonacci levels to signal possible trend reversals or continuations on a chart. Numerous harmonic patterns exist, each characterized by unique regulations and proportions. Examples like the Gartley, Bat, Butterfly, and Crab patterns are frequently seen.
Those who know how to draw harmonic patterns can pinpoint entry and exit points with minimal risk, potentially resulting in profitable trading of harmonic patterns. By examining the exact price movements that create these patterns, traders can predict market behavior more effectively than other techniques. Nevertheless, it is important to consider that although harmonic patterns are effective in various situations, they are not entirely reliable. Ongoing learning and practice are essential for successful trading of these patterns.
What is a Fibonacci Sequence?
The Fibonacci sequence is a series of numbers where each is the sum of the two preceding ones, beginning with 0 and 1. This sequence generates the "golden ratio," a unique relationship between the numbers that appear frequently in nature, art, architecture, and financial markets. In trading, Fibonacci ratios are crucial for identifying potential support and resistance levels essential in predicting market movements.
By understanding and applying the principles of the Fibonacci sequence, traders can improve the accuracy of their predictions and enhance the profitability of trading harmonic patterns.
Issues with Harmonics
Although harmonic patterns' advantages outweigh their challenges, traders should be aware of the former. One major issue is the precise alignment required with Fibonacci ratios. For instance, patterns like the bullish Gartley or other complex patterns rely heavily on exact Fibonacci retracement levels, such as 61.8% or 78.6%, to identify potential price movements. Any deviation from these precise measurements can lead to inaccurate predictions.
Another challenge lies in correctly identifying the different legs of the pattern, such as the AB leg or the BC leg. Misidentifying these legs can result in incorrect assessments of support and resistance levels, which are crucial for setting profit and loss targets. This can also impact the decision to take a long or short position in the market. For example, in a bearish pattern, an incorrect D point may falsely indicate a trend reversal, leading traders to enter a position in the wrong direction.
Furthermore, the complex structure of financial markets allows for the emergence of patterns across different timeframes and sizes. This could create challenges in differentiating between a slight pullback and a continuation formation or a major reversal in trend. Consequently, traders could mistake a brief trend reversal for a continuation of the main trend, resulting in potential financial losses.
The need for an accurate charting platform that can effectively plot Fibonacci grids and sequences is also crucial. Without proper tools, traders may find it challenging to draw these geometric shapes accurately, further complicating pattern analysis.
Types of Harmonic Patterns
There are many different harmonic patterns. Each of these patterns can signal either bullish or bearish market trends. Let’s consider the most common of them.
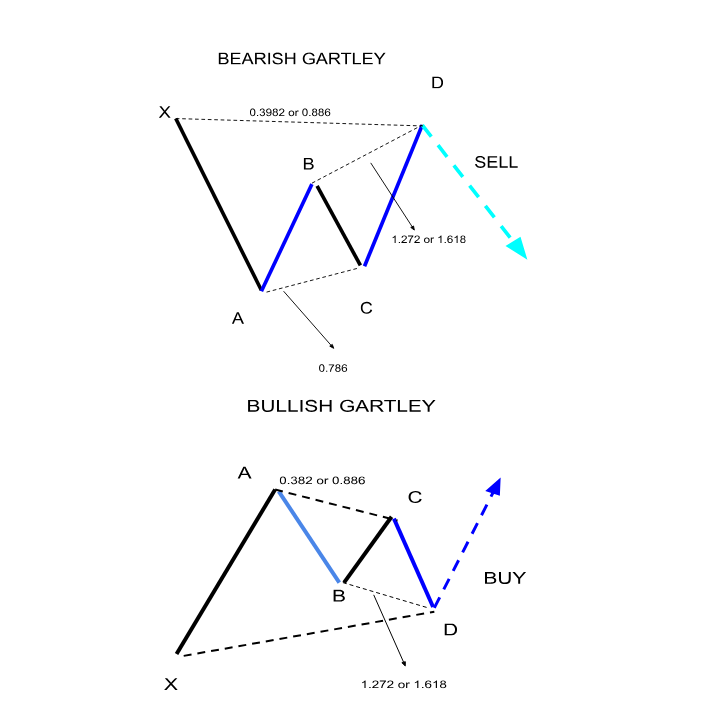
The Gartley
The Gartley pattern, introduced by H. M. Gartley in the 1930s, is a prominent harmonic chart pattern in technical analysis. It is used to identify potential reversals in market trends. The pattern is built on Fibonacci retracement levels, creating a visual sequence that traders can recognize. In a bullish Gartley, the pattern resembles an 'M' shape, suggesting a buying opportunity at the final point, D. In contrast, a bearish Gartley appears as a 'W,' indicating a selling opportunity at point D. The formation includes five key points: X, A, B, C, and D. The AB segment typically retraces 61.8% of XA, BC retraces 38.2%-88.6% of AB, and CD retraces 78.6% of XA. Understanding these retracement levels allows traders to anticipate market reversals and strategically plan their trades.
The Butterfly
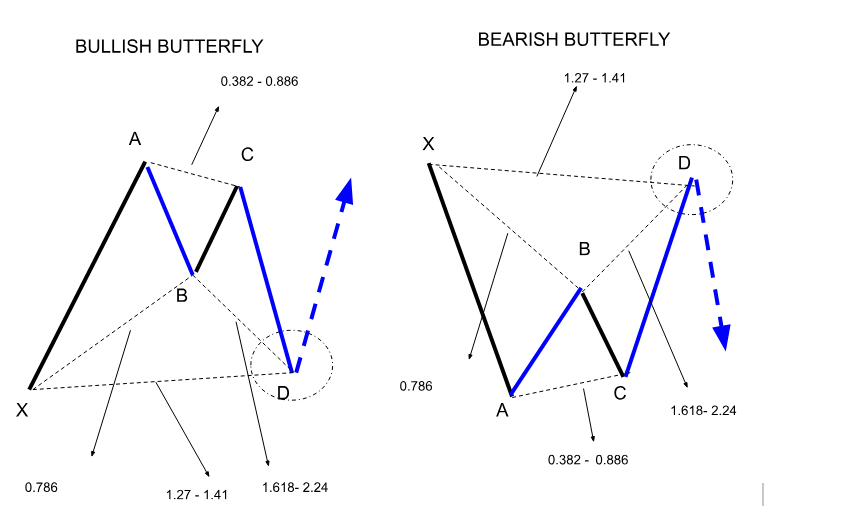
The Butterfly pattern is a notable harmonic pattern in technical analysis, used to forecast potential reversals in market trends. It includes five critical points (X, A, B, C, D) and four legs, each adhering to specific Fibonacci retracement and extension levels.
The pattern starts with an XA leg, followed by a retracement to point B, usually 78.6% of the XA movement. The next leg, BC, retraces between 38.2% and 88.6% of AB. Finally, CD extends from 1.618% to 2.618% of AB, leading to point D. This point marks the potential reversal zone. In this zone, traders decide to buy in a bullish scenario or sell in a bearish one, based on the pattern's formation.
The Butterfly pattern is valuable for its ability to highlight significant turning points, offering traders advantageous risk-to-reward opportunities by anticipating the end of prevailing trends. Understanding and identifying this pattern can enhance a trader's strategy by providing clearer entry and exit points.
The Bat
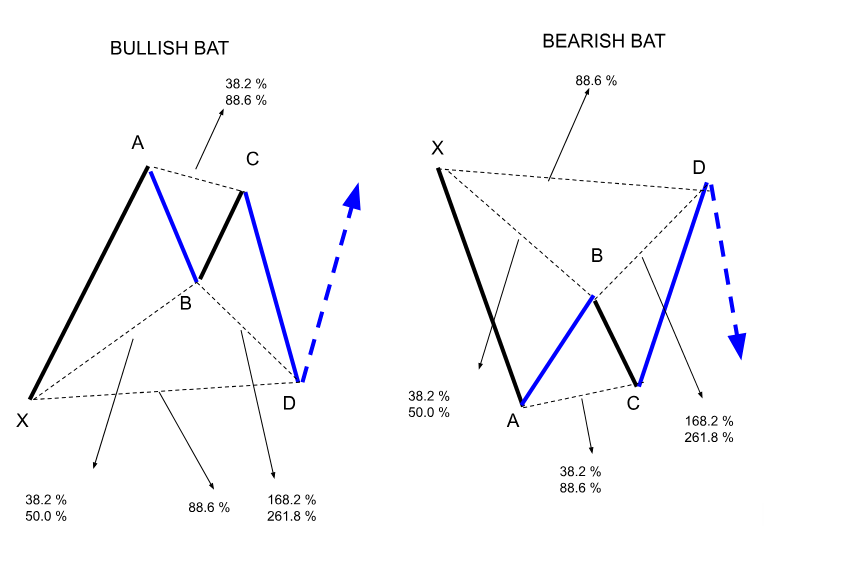
The Bat pattern is a harmonic trading pattern used to identify potential trade opportunities when a trend briefly reverses before continuing in its original direction. It includes five points (X, A, B, C, D) and follows specific Fibonacci ratios. In this pattern, the AB leg retraces 38.2% to 50% of the XA leg, while BC retraces between 38.2% and 88.6% of AB. The final CD leg extends from 1.618% to 2.618% of AB. This pattern is notable for its potential to offer entry points at favorable prices, either for long positions in bullish setups or short positions in bearish setups. The Bat pattern resembles a bat's wings on the chart and provides valuable insights for trading strategies.
The Crab
The Crab pattern, created by Scott Carney, is famous for its ability to forecast market reversals. This formation is notable for using the Fibonacci extension to identify the Potential Reversal Zone (PRZ), where a change in price movement is anticipated. The Crab pattern has the potential to be either bullish or bearish, determined by its positioning.
In a bullish Crab pattern, the market is anticipated to change direction upwards once it finishes forming. A bearish Crab, in turn, indicates a reversal in the downward direction. The development of the pattern is determined by particular Fibonacci ratios, with the most significant being the 1.618 extension of the XA leg used to pinpoint the PRZ.
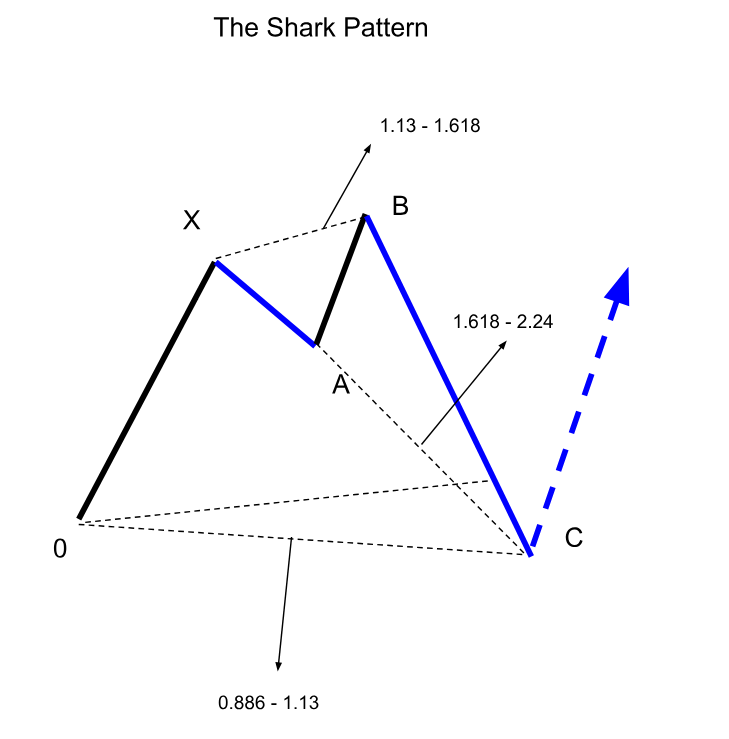
The Shark
The Shark pattern is distinctive among harmonic formations because of its special way of labeling using points O, X, A, B, and C. It follows a sequence starting with O, then moving to X, A, B, and finally C, forming a unique structure. Traders use specific Fibonacci ratios to recognize a Shark pattern: OX should range from 1.13 to 1.618 of XA, and BC should be between 1.618 and 2.24 of OX. Prices usually reverse at point C, commonly the trade entry point.
The Cypher
The Cypher pattern consists of five key points labeled X, A, B, C, and D, creating a unique shape that helps traders identify potential reversals. The formation starts with XA, and then moves back to point B, which needs to be between 38.2% and 61.8% of XA. Then, the structure continues to point C, expanding to 113% to 141.4% of XA. In conclusion, it usually finishes at point D, commonly found at the 78.6% retracement level of XC.
This price formation can suggest positive and negative market sentiment, offering adaptability in different market environments. Traders search for a trade entry at point D, where volatility frequently results in substantial price changes.
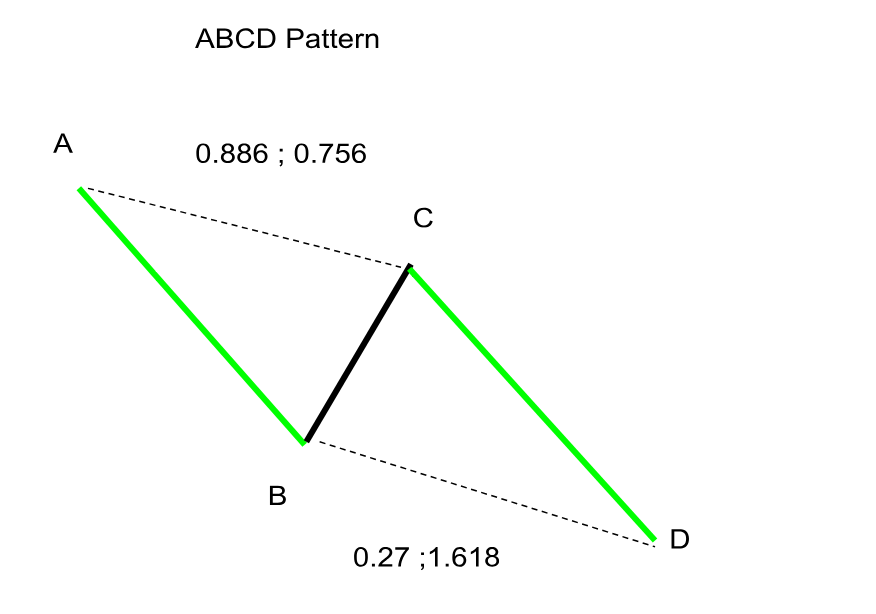
The ABCD Pattern
The ABCD pattern, known for its clear structure and predictable nature, is considered one of the easiest but most powerful harmonic patterns. It is made up of two equal legs: an impulsive movement (AB) followed by a corrective movement (BC), and then another impulsive movement (CD) in the opposite direction of AB. Traders usually use Fibonacci retracement ratios to recognize this pattern: the BC leg generally retraces between 61.8% to 78.6% of the AB leg, while the CD leg typically matches the length of the AB leg.
A key feature of the ABCD pattern is the Potential Reversal Zone (PRZ), where the CD leg is expected to end, signaling a possible reversal. This reversal zone, defined by precise Fibonacci ratios, provides traders an optimal trade entry point.
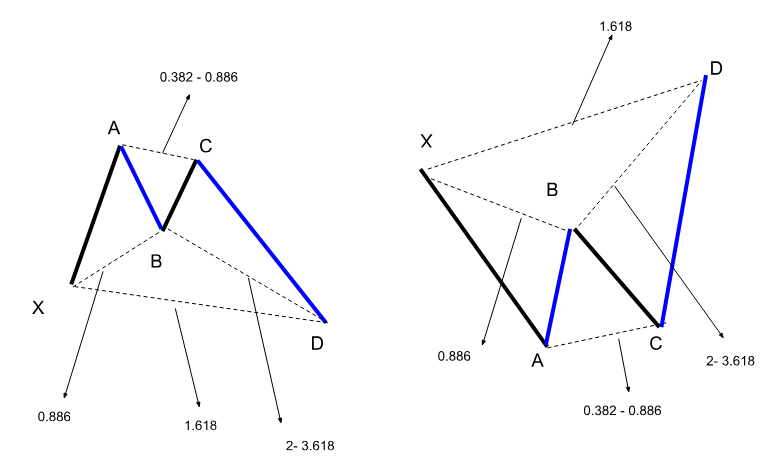
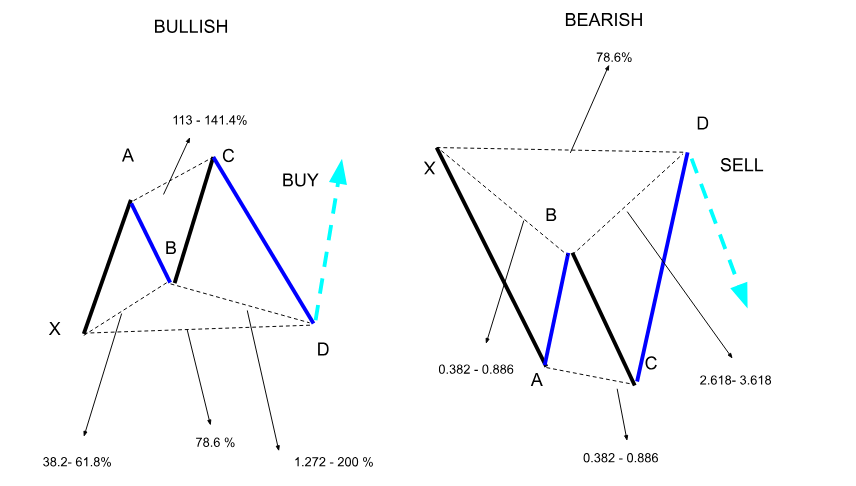
The Deep Crab Pattern
The Deep Crab pattern consists of five points: X, A, B, C, and D. The formation starts with an XA leg, followed by a retracement to point B, which should be a 0.886 Fibonacci retracement of XA. The BC leg then extends to 0.382 to 0.886 of AB, setting the stage for the critical CD leg. The CD leg is the most defining feature of the Deep Crab, as it extends to 2.618 to 3.618 of the XA leg. This extension leads to the Potential Reversal Zone (PRZ) at point D, where traders anticipate a potential price reversal. Moreover, point D is usually considered an optimal time to enter the trade.
Why are Harmonic Patterns so Popular in Forex Trading?
Harmonic patterns are widely favored in Forex trading because of their accurate and dependable nature. They use Fibonacci ratios to anticipate price changes, giving traders precise entry and exit points as such it’s easier to mitigate potential risks. Furthermore, their ability to recognize possible changes in highly volatile markets like forex makes them extremely valuable instruments.
How to Identify and Draw Harmonic Patterns
To identify and draw harmonic trading patterns, traders need to recognize whether it’s a bearish or bullish market and then pinpoint key price points on a chart, depending on the pattern. The next step is to apply Fibonacci retracement and extension tools to verify the pattern's ratios.
Bearish vs Bullish Harmonic Patterns: What is the Difference?
Bearish harmonic patterns indicate potential price decreases, guiding traders to sell positions. In contrast, bullish harmonic patterns signal potential price increases, prompting buy positions.
How to Start Trading with Harmonic Patterns
Starting to trade with harmonic patterns involves a few essential steps.
-
Educate yourself. If you are thinking of trading harmonic patterns thoroughly understand the theory behind them and get a clear understanding of their types.
- Choose a strategy. Decide whether to adopt a bearish or bullish strategy based on your market outlook.
- Set targets. Establish clear profit and loss targets to mitigate your risks.
- Identify entry and exit points. Use Fibonacci ratios to pinpoint precise entry and exit points, ensuring proper pattern identification.
- Open a trading account. Choose a reputable brokerage platform like J2T that will provide you with all the tools for harmonic pattern trading.
- Practice on a demo account. Gain experience and refine your skills on a demo account to practice trading without financial risk.
Conclusion
Harmonic patterns are accurate tools to forecast market movements using Fibonacci ratios to pinpoint likely reversal zones. Major patterns such as Shark, Cypher, ABCD, and Deep Crab offer distinct entry and exit signals. However, despite being popular due to their accuracy, traders must stay vigilant of possible risks, such as misidentification and market fluctuations. Practicing with demo accounts and conducting in-depth analysis can reduce these risks and improve your trading results.
FAQs
What are harmonic patterns?
Harmonic patterns are geometric patterns appearing on stock market charts created by Fibonacci sequences. By recognizing particular price movements and levels of support and resistance, they assist traders in anticipating changes in trends, as well as offering profit objectives and risk control.
What is the most powerful harmonic pattern?
Many believe that the Gartley pattern is the most influential harmonic pattern. Pattern analysis is utilized in the stock market to predict trend reversals with accuracy, using specific Fibonacci ratios to determine reliable entry and exit points.
Does harmonic trading really work?
Most harmonic patterns work effectively when they align accurately with Fibonacci ratios. It helps identify trend reversals and set profit targets, but its success depends on precise pattern recognition and market conditions in financial markets.
What is the ABCD pattern of harmonics?
The ABCD pattern is a simple harmonic pattern where the AB and CD legs are of the same length, and the BC leg retraces a portion of AB. It's used for identifying potential trend reversals and setting profit targets.
What are the harmonic patterns for beginners?
Beginners often start with simpler patterns like the ABCD and Gartley, which use basic Fibonacci ratios and are easier to identify. These patterns help to understand the fundamental principles of harmonic pattern analysis in financial markets.
What are the most popular harmonic patterns?
The most popular harmonic trading patterns include the Gartley, butterfly, bat, and crab patterns. These patterns are widely used for their ability to predict trend reversals and set precise profit targets using Fibonacci ratios in the stock market.