Support and Resistance
)
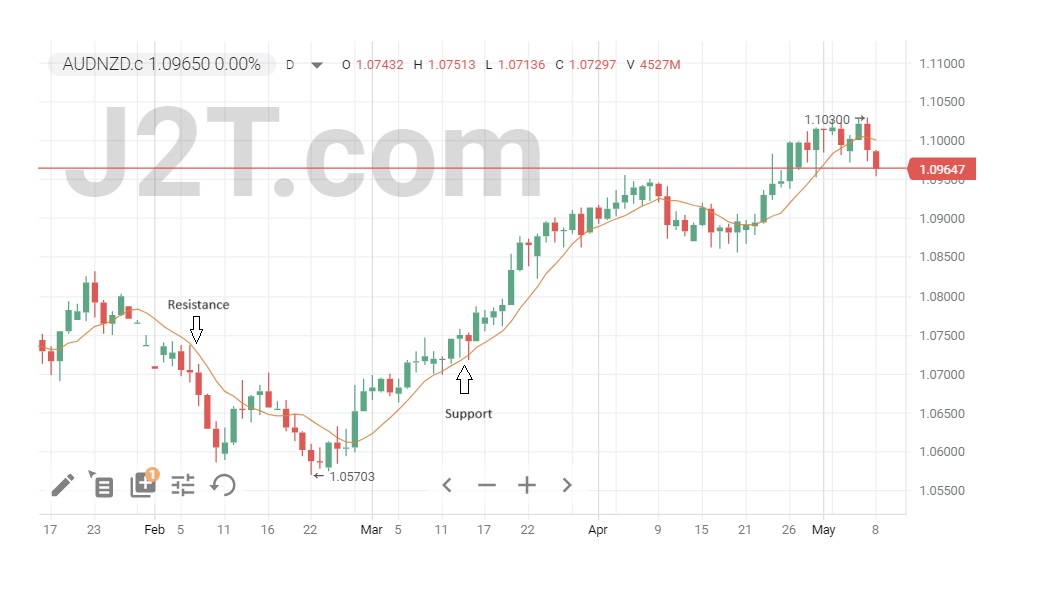
Support and resistance levels are key technical analysis concepts that act as barriers to price movements. Support is when buyers come in at a certain price level to create more demand, stopping or changing a downward trend. On the contrary, resistance is a level where more sellers than buyers exist, hindering the price from increasing.
In our complete guide, we have gathered all the necessary information to provide you with a clear picture of support and resistance, including key definitions, their types, compatibility with other technical indicators, and trading strategies. Read on to educate yourself more about this powerful tool and implement it for more informed trading decisions.
Table of Contents
Key Takeaways
What Is Support?
What Is Resistance?
Types of Support and Resistance
How to Identify Support and Resistance Levels
Trendlines
Round Numbers
Moving Averages
Other Indicators
How to Trade with Support and Resistance
Bottom Line
FAQs
Key Takeaways
-
Support and resistance levels are technical analysis tools that serve as obstacles to price changes. Support signals demand from buyers, and resistance signals supply from sellers.
- Key types of support and resistance include fixed, dynamic, and semi-dynamic levels.
- Support and resistance levels can be determined by utilizing trendlines, round numbers, moving averages, and various technical indicators.
- Support and resistance levels can be implemented together with various trading strategies (such as range trading and breakout trading) to help determine entry and exit points, as well as improve your risk management plan and overall trading decision-making process.
What Is Support?
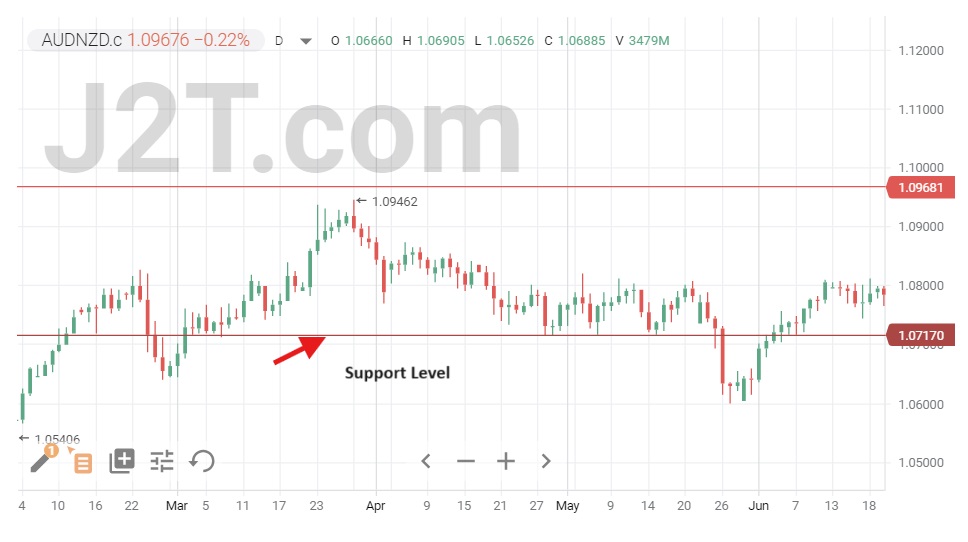
Support is a point at which demand for buying is typically stronger than the demand for selling, suggesting a potential stop or shift in a downward trend. Simply put, a support level is a specific price at which many buyers are ready to buy the asset. As such, the rising demand could prevent the asset's price from dropping more, or even possibly reverse the downward trend.
New support levels are usually illustrated on charts with horizontal lines, also called support lines. They serve as visual indicators, showing where there could be strong purchasing interest and a possible price rebound.
It should be emphasized that support levels are not firm boundaries; they may be breached, especially when there is intense selling pressure or important market events. Nevertheless, they offer valuable information about potential locations where the price could receive temporary support, enabling traders to make well-informed choices.
Where Is Support Set?
Support levels are typically set below the current asset price at some important historical price levels. This can involve prior bottoms, important moving averages, Fibonacci retracement levels, trend lines, or points with higher trading activity or volume. However, it's common for prices to fluctuate and momentarily drop below these support levels. Therefore, traders define support not just as a precise point, but as a zone that may attract buyers again.
What Is Resistance?
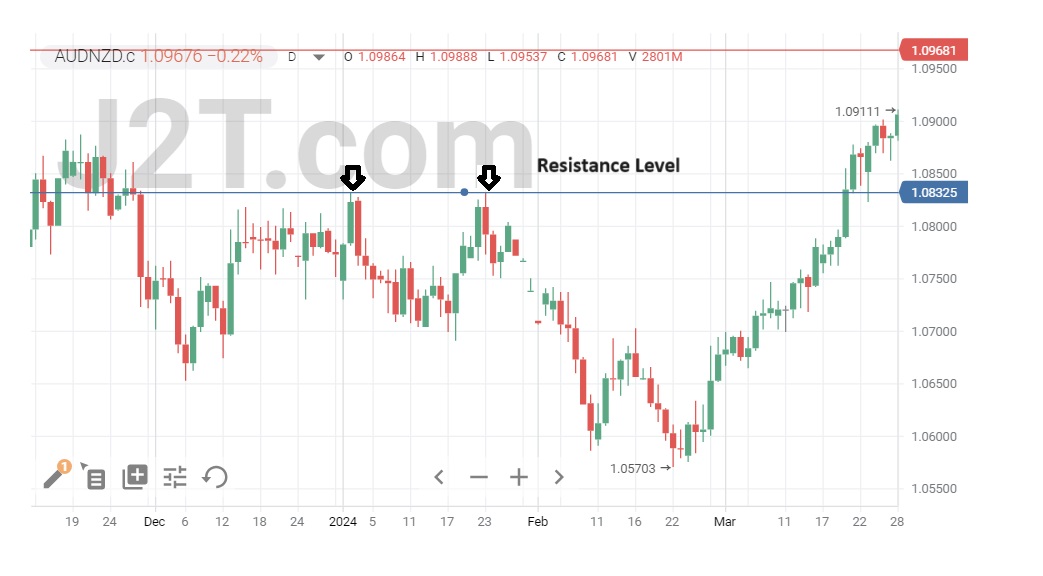
Resistance is the opposite concept of support. It is a point at which there is more selling than buying pressure, suggesting a possible pause or reversal in an upward trend. At a certain point of resistance, many investors are ready to sell their assets, leading to an excess supply that can serve as a barrier to further price increases. This higher selling pressure could lead to the asset's price halting or even changing direction from rising.
Just as with support levels, resistance is commonly shown on charts using horizontal lines called resistance lines. They pinpoint where the price might meet strong selling pressure and struggle to break through.
Where Is Resistance Set?
Resistance levels are formed above an asset's current price. Following the same logic as with support levels, resistance lines are established at important price levels observed in the past.
Note that asset prices can be unpredictable and might briefly spike above these levels. As such, many traders and investors prefer to think of resistance not as a single price point, but as a zone where the price might struggle to rise further.
Types of Support and Resistance
Understanding various types of support and resistance levels is imperative for successful technical analysis. In this section, we will have a look at them and their features.
Fixed Support and Resistance Levels
Fixed support and resistance are price points with a psychological or historical significance, often represented by round numbers or significant price levels from the past. These levels tend to be relatively static and can act as barriers for the price movement.
Examples of fixed support and resistance levels include major psychological levels (e.g., $50 or $100), previous highs or lows, and key technical indicators like the 200-day moving average.
Dynamic Support and Resistance Levels
Dynamic support and resistance levels are constantly changing and are derived from technical indicators or price patterns that adapt to market conditions. These levels are not fixed; they move in tandem with the price action, providing a more responsive and dynamic framework for analysis.
Examples of dynamic support and resistance levels include trendlines, moving averages (e.g., 20-day, 50-day), and technical patterns like triangles, channels, or Fibonacci retracements.
Semi-Dynamic Support and Resistance Levels
Semi-dynamic support and resistance levels combine elements of both fixed and dynamic levels. They are predetermined at a fixed rate or interval, but can adjust based on specific criteria or market conditions.
Examples of semi-dynamic support and resistance levels include pivot points (calculated using predetermined formulas based on the previous day's trading range) and resistance lines drawn from significant swing highs or lows at a predetermined rate or angle.
How to Identify Support and Resistance Levels
Support and resistance levels represent the psychological points where financial asset prices typically stop and change direction. Here is a basic method for identifying these important levels:
-
How to identify support. A support level is where the price of an asset tends to stop falling and bounces back up, acting as a psychological price floor. To find a support level, search for areas on the chart where the price has dropped multiple times but continuously resists moving further down. These are regions where buyers traditionally intervene, viewing the reduced prices as chances to make purchases. This level indicates the point at which the strength of buying interest outweighs the pressure to sell.
- How to identify resistance. Conversely, a resistance level is where the price stops rising and begins to fall again. This is essentially the ceiling of price movements where selling interest overcomes buying pressure. To determine resistance, locate areas on the chart where the price has risen to but has dropped from multiple times. These peaks are indicative of points where sellers start to outnumber buyers, driving the price down.
While trying to set support and resistance zones, keep in mind these useful tips:
- Use horizontal lines. Place horizontal lines on your chart at points where price reversals have occurred frequently. These lines will help visualize and anticipate future price stops or reversals.
- Continuously monitor price movements. Keep an eye on how prices behave as they approach these levels. A true reversal might often be accompanied by high trading volumes, indicating strong interest at these price points.
Trendlines
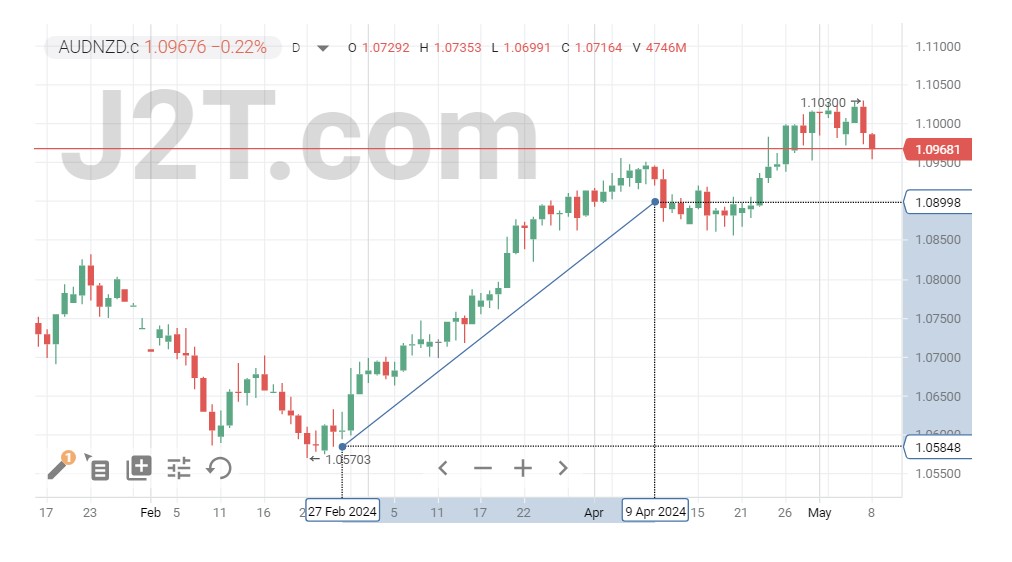
Trendlines are essential tools in technical analysis that enhance the basic idea of horizontal support and resistance by considering the price action's direction. They provide useful guidance on where financial asset prices could receive support or face resistance, depending on current market trends.
To draw a trendline, just link two or more price points on a chart together. To create a support trendline, join the lowest points of the price movement where the prices ceased dropping and started to rise again. Make sure the trendline links a minimum of two lowest points to be valid—just remember, the more points it intersects, the stringer and more important the trendline gets. This line can be useful in forecasting where the price may encounter support as it decreases in a downtrend or retraces in an uptrend.
For resistance trendlines, connect declining peaks where the price has topped out and started to drop. This is crucial during a downtrend to identify where each rebound may falter, or in an uptrend to determine where the price might struggle to climb higher. Just like support lines, the validity of a resistance line increases with the number of contact points.
Unlike horizontal lines, which represent a constant level, trendlines adjust with the slope of the market movement. This makes them particularly useful in capturing the sentiment of a trending market. A steep trendline can indicate strong buying or selling pressure, while a more gradual slope might suggest a less aggressive market sentiment.
When using trendlines, watch how the price action behaves as it approaches these lines. A break through a trendline often signals a potential change in the market direction, offering trading opportunities. Conversely, a bounce off a trendline can reaffirm the existing trend, providing confidence in continued support or resistance at these dynamic levels.
Round Numbers
Round numbers have a psychological impact on trading. They serve as hidden price barriers that have the ability to sway the actions of retail investors and inexperienced traders. Round numbers (like 10, 20, 50, 100, etc.) are commonly used to establish target prices or stop orders, assuming that others will do the same, potentially leading to self-fulfilling prophecies in market dynamics.
When it comes to support and resistance, round numbers frequently serve as default levels due to the attention they receive from market participants, who may use them as a basis for making decisions. For instance, when a stock gets close to a round number above its present value, traders may view it as a level of resistance where they could sell for a profit, potentially halting or reversing the price rise. On the other hand, a round number lower than the current price can serve as a level of support, prompting traders to view it as a favorable buying opportunity, leading to a rise in demand and stopping any further decrease in price.
If you want to include round numbers in your trading plan, it’s important to observe how prices act close to these levels, and predict possible market changes using trader psychology. This knowledge can offer a strategic advantage, particularly in extremely unstable or upward-trending markets.
Moving Averages
Moving averages are essential technical analysis tools that provide a smoothed line of past price data, and help traders identify support and resistance levels over various time frames. These averages help clarify the direction of the market trend and gauge short-term momentum, making them vital in both setting and confirming potential price barriers.
Moving averages act as dynamic support and resistance levels. For instance, in a rising market, a moving average can serve as a support line that the price might test but not readily break below. Conversely, in a downtrend, it can act as a resistance line where price struggles to break above. Technical traders often draw trendlines alongside moving averages to assess market sentiment and identify entry and exit points based on these interactions.
Other Indicators
Beyond the basic tools like trendlines and moving averages, several other technical indicators can enhance the identification and interpretation of support and resistance levels. These indicators provide deeper insights into price action and help refine trading strategies. Let’s have a closer look at some of them.
-
Volume-based indicators. Volume plays a crucial role in validating recognized levels of support and resistance. The Volume-Weighted Average Price (VWAP) and the On-Balance Volume (OBV) are examples of indicators that connect the price movement to the amount of shares traded. These signals can indicate if traders' dedication supports a shift beyond a support or resistance level, revealing the strength or weakness at these specific points.
- Oscillators. Indicators such as the Relative Strength Index (RSI) and Stochastic can hint at possible support and resistance levels by indicating overbought or oversold conditions. For example, an RSI that is excessively sold near a recognized support level may indicate a probable recovery, whereas an RSI that is excessively bought at resistance could indicate an upcoming decrease in price.
- Fibonacci retracements. Traders apply Fibonacci ratios—primarily 23.6%, 38.2%, 50%, 61.8%, and sometimes 76.4%—to measure how much of a prior move the price retraces before continuing in the original direction. These percentages are marked on the chart from the high and low of the price move, creating horizontal lines that represent potential support and resistance levels.
How to Trade with Support and Resistance
Trading with support and resistance levels is a fundamental strategy that uses price points where securities typically stop and reverse. Understanding how to leverage these levels can significantly enhance trading strategies by providing clear signals for entry and exit points. Below, we will explore two popular strategies: range trading and breakout trading.
Range Trading
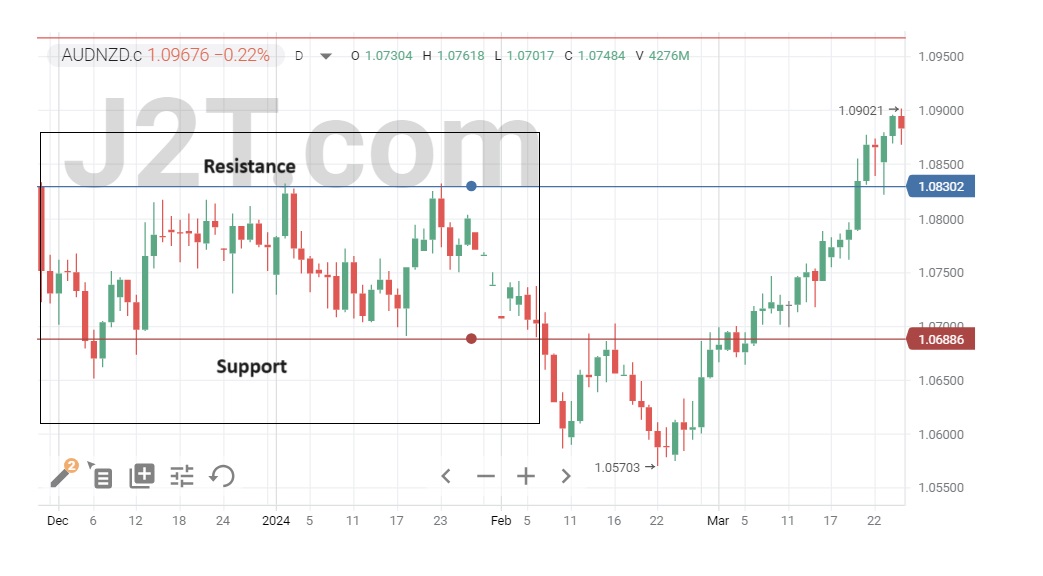
Range trading is a technique in which traders take advantage of expected price changes within a specific price range. This tactic works well in a range-bound market, with prices moving between distinct support and resistance levels without showing a clear trend.
Here are some important points on this strategy:
- Determine the range. First, pinpoint the highest and lowest price levels which have commonly served as resistance and support. Make sure that these levels have undergone numerous tests with no instances of failure.
- Find the most suitable entry and exit points. The best time to enter a buy trade is at the support level when the price is anticipated to rise. On the other hand, the most attractive selling point is usually close to the resistance level, indicating a probable price decline.
- Use indicators. To improve trade accuracy, traders can use momentum indicators such as the Relative Strength Index (RSI) or Stochastic Oscillator to verify if the price will potentially reverse upon reaching these points.
- Risk management. Place stop-loss orders slightly beyond the established support and resistance levels. This will help to control risk, and guarantee that trades are closed if the price unexpectedly surpasses these levels.
Breakout Trading
Support and resistance trading using the breakout technique involves entering a trade as the price breaks beyond a defined support or resistance level, typically during a period of consolidation. This strategy bets on the momentum continuing in the direction of the break, often leading to significant price movements.
Here are some important points to remember about this strategy:
-
Spot the breakout. Watch for a period of consolidation near a key support or resistance level. A breakout is confirmed when the price closes beyond this level at increased volume, indicating the potential start of a new trend.
- Decide on the entry points. After a breakout, the optimal entry point is typically after a retest of the broken support or resistance level, which now serves an opposite role (former resistance turns into support, and vice versa).
- Confirm the momentum. Use momentum indicators to verify that the breakout has the power to maintain a new trend. Indicators like MACD or volume offer extra information on the market's momentum.
- Adhere to the current trend. Establish profit goals and stop-loss orders using support or resistance levels after the breakout point. It’s crucial to modify these strategies as the price changes in order to secure profits and decrease potential losses.
Bottom Line
In summary, support and resistance levels represent areas where the price of a financial asset tends to encounter buying or selling pressure, potentially leading to a reversal or consolidation. While plotting support and resistance is not an exact science, it provides valuable insights into market dynamics.
Identifying and incorporating these levels into trading strategies helps traders predict price changes, handle risk more efficiently, and boost their likelihood of success in the constantly evolving financial markets.
FAQs
What Are the Rules for Support and Resistance?
Support occurs when buying interest is high enough to halt the price from falling further, while resistance occurs when selling pressure prevents the price from rising. These levels can be identified using pivot points, trend lines, and historical price data.
What Do Support and Resistance Level Breaks Signify?
When a price moves through a support or resistance level, it often indicates a strong shift in market sentiment. A broken support level may lead to lower prices, whereas breaching resistance can push prices higher.
How Is the Concept of Supply and Demand Related to Support and Resistance?
Supply and demand dynamics are fundamental to identifying support and resistance zones. Support levels indicate that more buyers are entering the market, providing support. Conversely, resistance areas show where increased supply (selling) prevents price advances.
How Are Support and Resistance Levels Related to Trading Ranges?
Support and resistance levels frame the trading ranges where financial assets fluctuate. The upper boundary of a range provides resistance, while the lower boundary provides support, guiding many traders in their buying and selling decisions.
How Do You Master Support and Resistance?
Mastering support and resistance involves consistent analysis of charts in order to recognize patterns where resistance support consistently halts price climbs and support levels sustain prices. Monthly charts can help visualize these zones clearly, aiding in better prediction of future price moves.