VWAP

Table of contents:
Key Takeaways
What is VWAP?
Importance of Volume Weighted Average Price
How to Calculate VWAP
How To Use volume weighted average price (VWAP)
Examples of VWAP In Action
Limitations of VWAP
Bottom Line
FAQs
Many indicators in trading help make the right decisions in the market. This article is dedicated to one of these indicators - VWAP (volume weighted average price). VWAP helps traders determine the trend, and find an entry point or a position closing point. In this article, we will also discuss how the weighted average price VWAP calculated, how to use this index and show examples and limitations of this metric.
Key takeaways:
-
VWAP is a technical metric used to determine the market trend.
- Volume weighted average price is calculated from the average price multiplied by the trading volume at a given moment.
- VWAP can serve as additional confirmation of a bearish or bullish trend, however, its presence alone will not give you much, as it must be combined with other metrics.
- Weighted average price VWAP is generally most useful to short-term traders.
What is VWAP?
VWAP (Volume Weighted Average Price) is a technical analysis index that shows the typical price value calculated by the arithmetic mean of the highs, lows, and closing price of a candle and by volume. The metric shows the average value within a day during a trading session. VWAP provides traders with important information about the trend and value of a stock.
Weighted average price VWAP comprises the total amount of capital in each transaction and then divided by the total number of transactions.
Importance of Volume Weighted Average Price
VWAP has several important applications, and for this metric to help you in trading, you need to understand what it is created for.
1. It Can Indicate If The Market Is Bearish Or Bullish
VWAP can be a great indicator of a bearish or bullish market. If the stock is trading above volume weighted average price, the trend is bullish, if below, the trend is bearish. Then, depending on where the asset is trading, the trader can go long or short.
VWAP can be a support or resistance level for a trader, volume also plays a role. If we see a large volume of trades above the metric, this is a bullish impulse. If there is a large volume below the volume weighted average price, this will be a bearish impulse.
In general, Weighted average price VWAP can help determine the direction of the trend, but it cannot accurately predict whether the market is bearish or bullish. For a more accurate analysis, it is necessary to use other tools and indexes.
2. You Will Know When To Sell Or Buy
Although a buy or sell decision cannot be made based on the index alone, VWAP can serve as an auxiliary tool in your trading and confirm or disprove your hypothesis.
A buy decision can be made based on the VWAP indicator if: the stock’s graph line breaks through index with high volume; if the stock’s value touches the volume weighted average price and bounces off it with high volume; if the volume weighted average crosses the moving average upwards, this may indicate a change in trend towards growth and may be a signal to buy.
A sell decision can be made if: the stock breaks through the index with high volume; if the graph line bounces off the index downwards with high volume.
3. It Is A Better Tool Than The Moving Average
Moving Average and weighted average price VWAP are different tools that show slightly different values. Moving Average takes into account only the stock’s typical price for a certain period, while volume weighted average price also takes into account the volume, which plays an equally important role in pricing. In general, Moving Average and VWAP are used for approximately the same purposes - to determine the trend, find the entry point.
How to Calculate VWAP
In most cases, you won't have to make a VWAP calculation since this anchored VWAP is on trading services. But if you want to make VWAP calculation yourself, here are the steps you need to take:
- First, the VWAP formula consists of the typical value for the first five minutes of trading. To do this, add up the maximum, minimum of the 5-minute candle, and the closing price of this candle, and divide it all by 3. Multiply the resulting number by the trading volume for this period.
- Divide this number by the volume for this period. This will create an index.
- While calculating VWAP further during the day, add the remaining values to the number from point 1 and divide it all by the total trading volume up to this point.
How To Use volume weighted average price (VWAP)
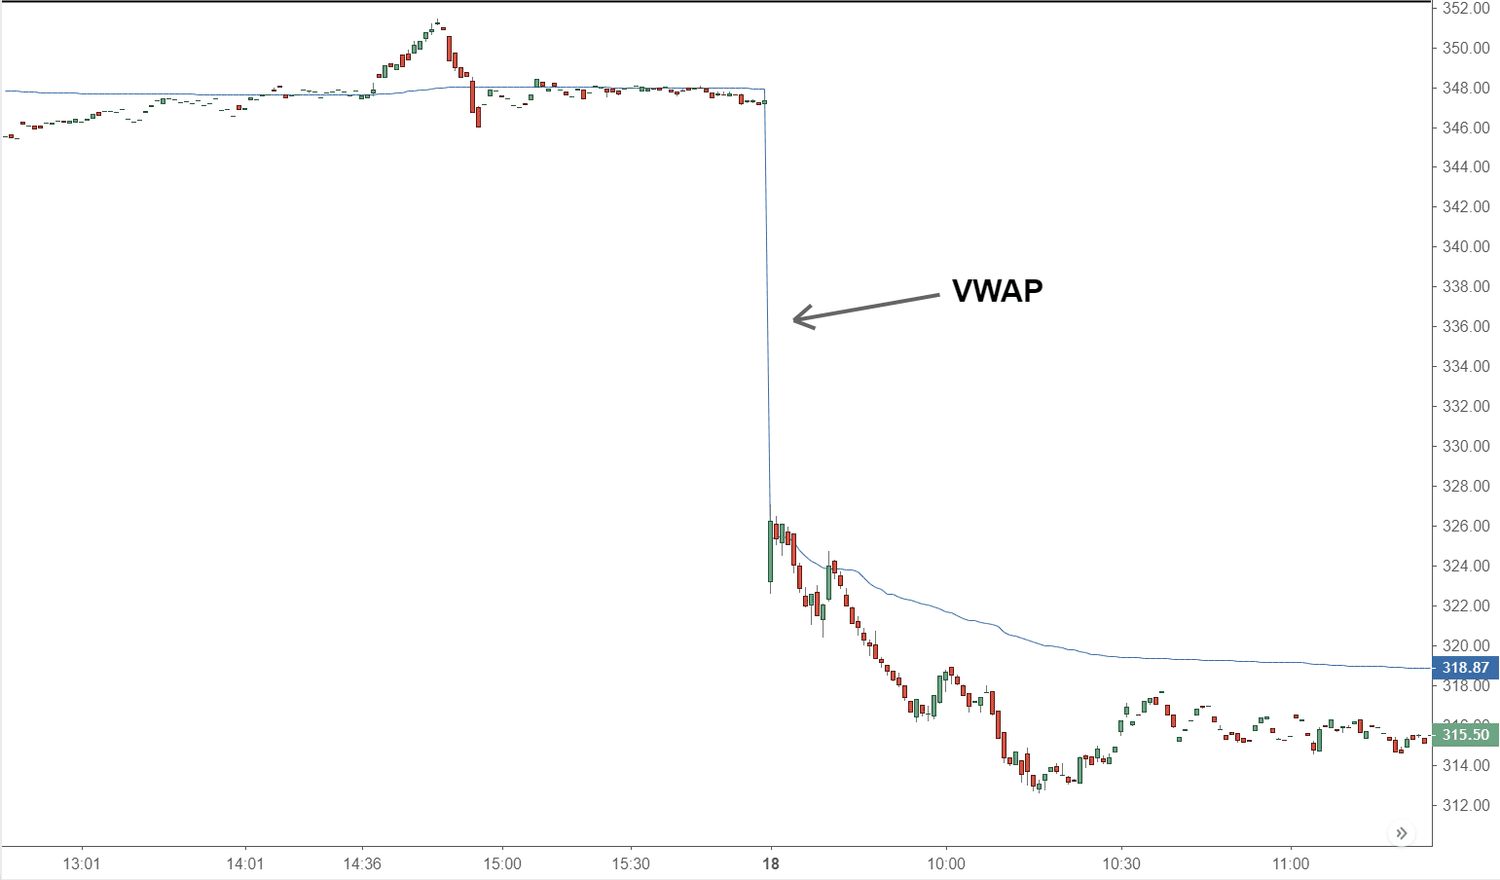
Imagine a price chart with a significant line representing this index. As the chart approaches this line, we can observe its behavior. For instance, we might see a period of consolidation near volume weighted average price, followed by a break above or below the line. This break can indicate a shift in momentum, potentially leading to a trend.
If the graph line moves below VWAP and quickly closes above it, it could signal increased buying activity. This could encourage traders to consider a long position, with a stop order below a previous low point.
However, the interpretation of this metric is not always straightforward. Sometimes the market might break below the lower band or above the upper band, creating a different dynamic. It's crucial to observe the context and combine VWAP with other technical indicators, such as the Relative Strength Index (RSI) or moving averages, for a more comprehensive understanding of the market.
Examples of VWAP In Action
VWAP, or Volume Weighted Average Price, is a key player in corporate finance, particularly in share buybacks and mergers & acquisitions.
When a company like Guess utilizes an Accelerated Share Repurchase (ASR) agreement, VWAP determines the final number of shares repurchased, ensuring a fair value amidst market fluctuations.
In mergers like Public Storage's acquisition of Life Storage, volume weighted average price is used to calculate the exchange ratio, ensuring a fair valuation for both companies based on their recent trading history.
Limitations of VWAP
The volume weighted average price has its limitations. One of them is that the index calculates the average value within a day, attempts to calculate the average value for several days can lead to an erroneous result. VWAP is not the only mark of a trend, it does not give an understanding of when a trend will start and when it will fade, therefore, it is impossible to predict a trend in advance using only one metric. If the graph line goes beyond the volume weighted average price, then the trend has already begun.
Bottom Line
Although the volume weighted average price is a very useful indicator, you should not build your entire trading strategy around one indicator. In order to trade effectively and leave the market with money, your strategy must consist of many factors of technical and fundamental analysis.
FAQs
What Does the VWAP Tell You?
VWAP can indicate the beginning of a strong trend or show an entry point.
Is VWAP a Leading Indicator?
It is one of the leading indicators but should be used with other indicators and metrics.
What Is The VWAP Strategy?
If the graph line breaks the volume weighted average price with a large volume, then this indicates the beginning of a strong trend and you can look for trades. If the graph line bounces off the VWAP with a large volume, then this can serve as an entry point.
Is VWAP Bullish Or Bearish?
The indicator can be used both in bearish and bullish periods.
What Is The Success Rate Of VWAP?
VWAP doesn't have a specific success rate as it's a tool, not a strategy. Its effectiveness depends on the way it is used, market conditions, and trader skill. It's often combined with other indicators for better results.